The Nonlinear dynamics program module allows you to study the chaotic nature of the heart rate, fluctuations in the recording process, fractal, self-similar structure of the ECG signal.
Module contains 4 tabs
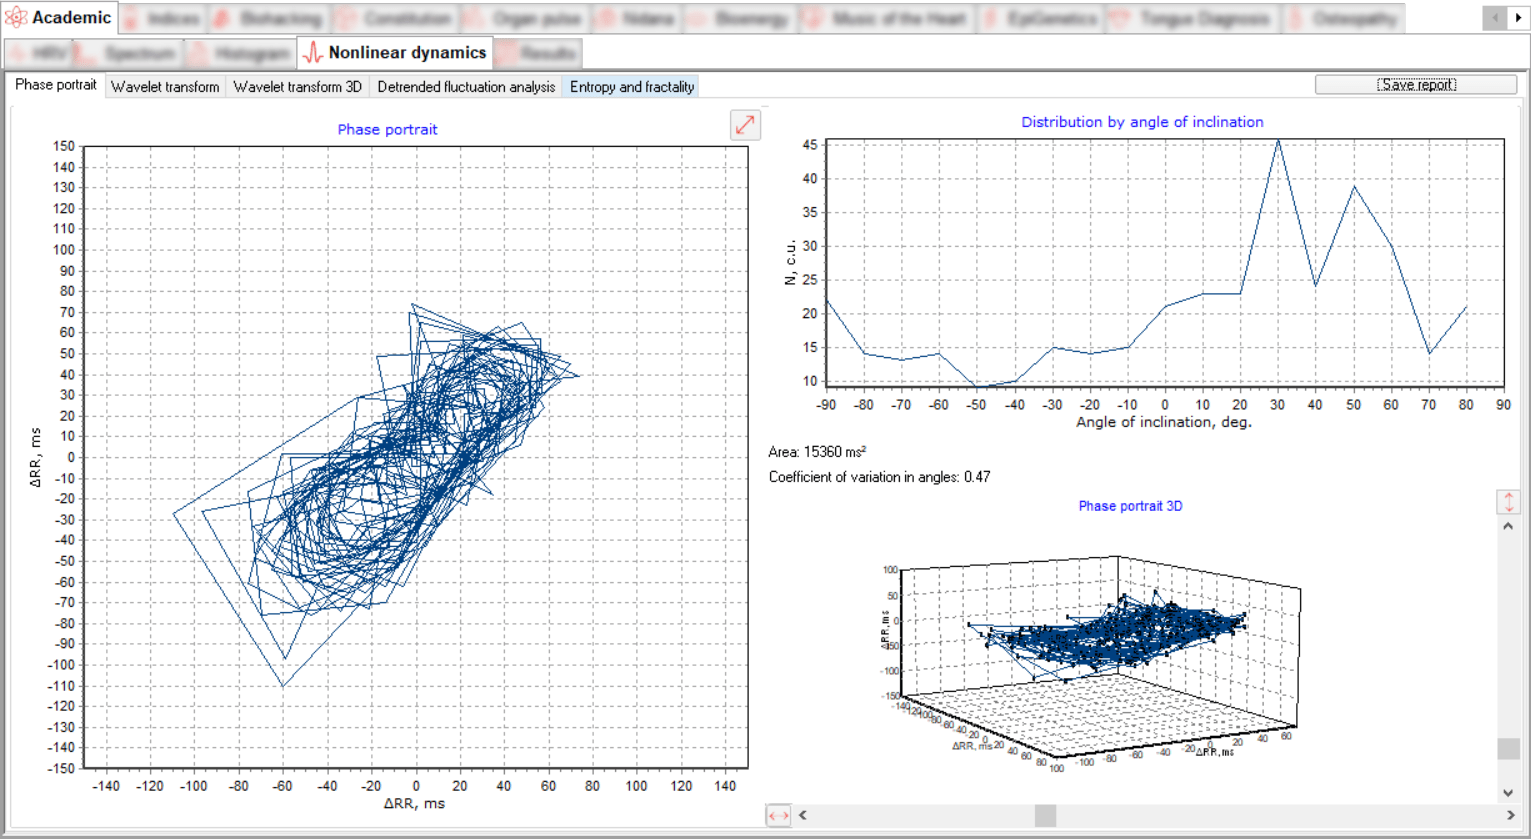
A dynamic chaosogram is a geometry of points in the phase plane whose coordinates are increments of neighboring cardiointervals. When analyzing the data, it is advisable to pay attention to the shape of the chaosogram and the distribution of its lines at the angles of inclination.
A healthy person is characterized by stable ellipsoidal cycles with a single point of attraction and spider-like chaosograms. When the sympathoadrenal regulation department is activated, the size of such an ellipse decreases. On the contrary, when vagal regulation is dominant, it increases. The point of attraction is maintained.
The triangular trajectories of the chaosogram indicate tension and instability. There are zones of instability (ectopic foci) and the system jumps from one unstable state to another. Patients with acute coronary syndrome are characterized by such chaosograms, and the more acute stages coordinate with the sharper angles of the vertices of the triangle.
With multiple extrasystoles, the chaosgram takes on a pointed appearance. In atrial fibrillation, the chaosgram shows lines drawn in a disorderly manner. In patients with coronary artery disease with post-infarction cardiosclerosis, the heart rhythm is rigid, the chaosgram has the shape of a "bagel".
Chaosograms of patients with atrial fibrillation are characterized by the formation of lines whose size and orientation change randomly. There is no point of attraction, indicating that the heart rhythm is disorganized.
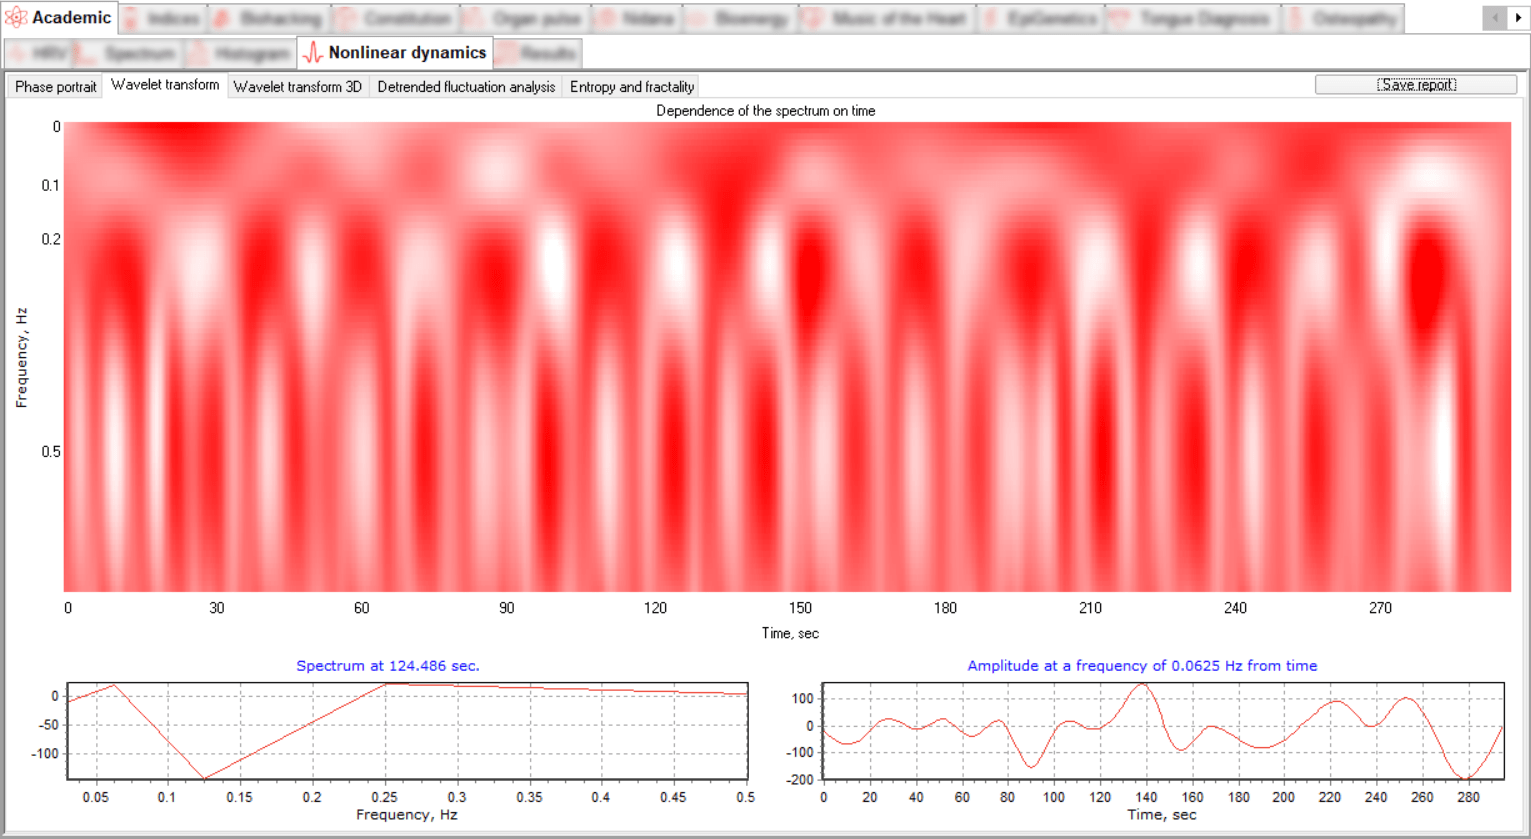
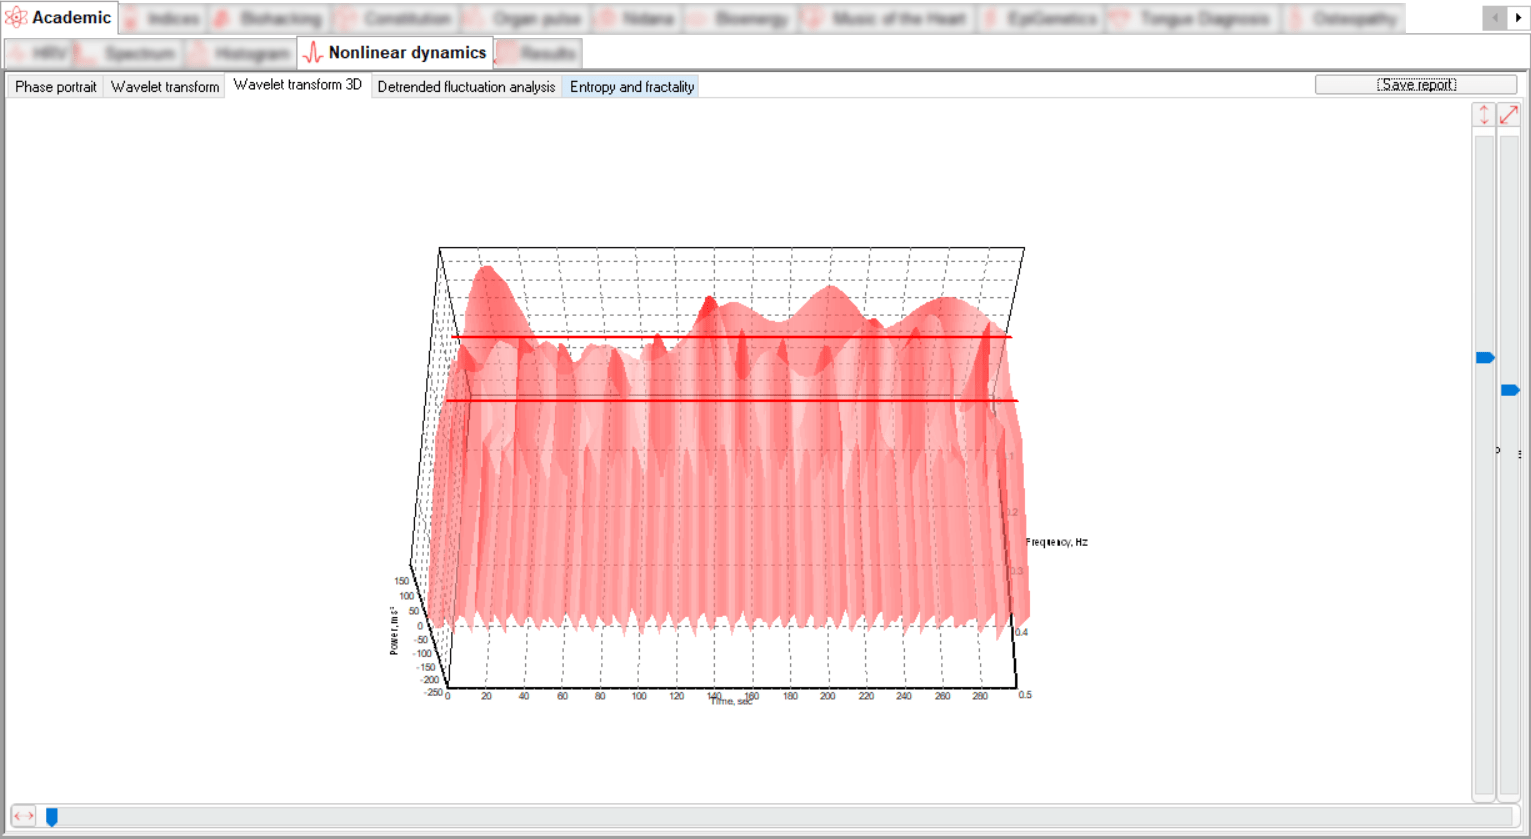
The analytical value of such a graphical display of the signal allows you to follow both changes in time and changes in frequency simultaneously. This method of visualization allows us to detect morphological differences between ECG signals, as well as possibly analyze individual peaks and segments. The software presents the data on a plane and in a 3D visualization format.
The ECG signal is located in the "power - frequency - time" coordinates, where we can follow the dependence of the signal spectrum on time. The time-frequency representation of the signal is displayed in two tabs, Wavelet Transform and 3D Wavelet Transform.
Two dynamic graphs show the spectral and temporal decomposition of the signal.
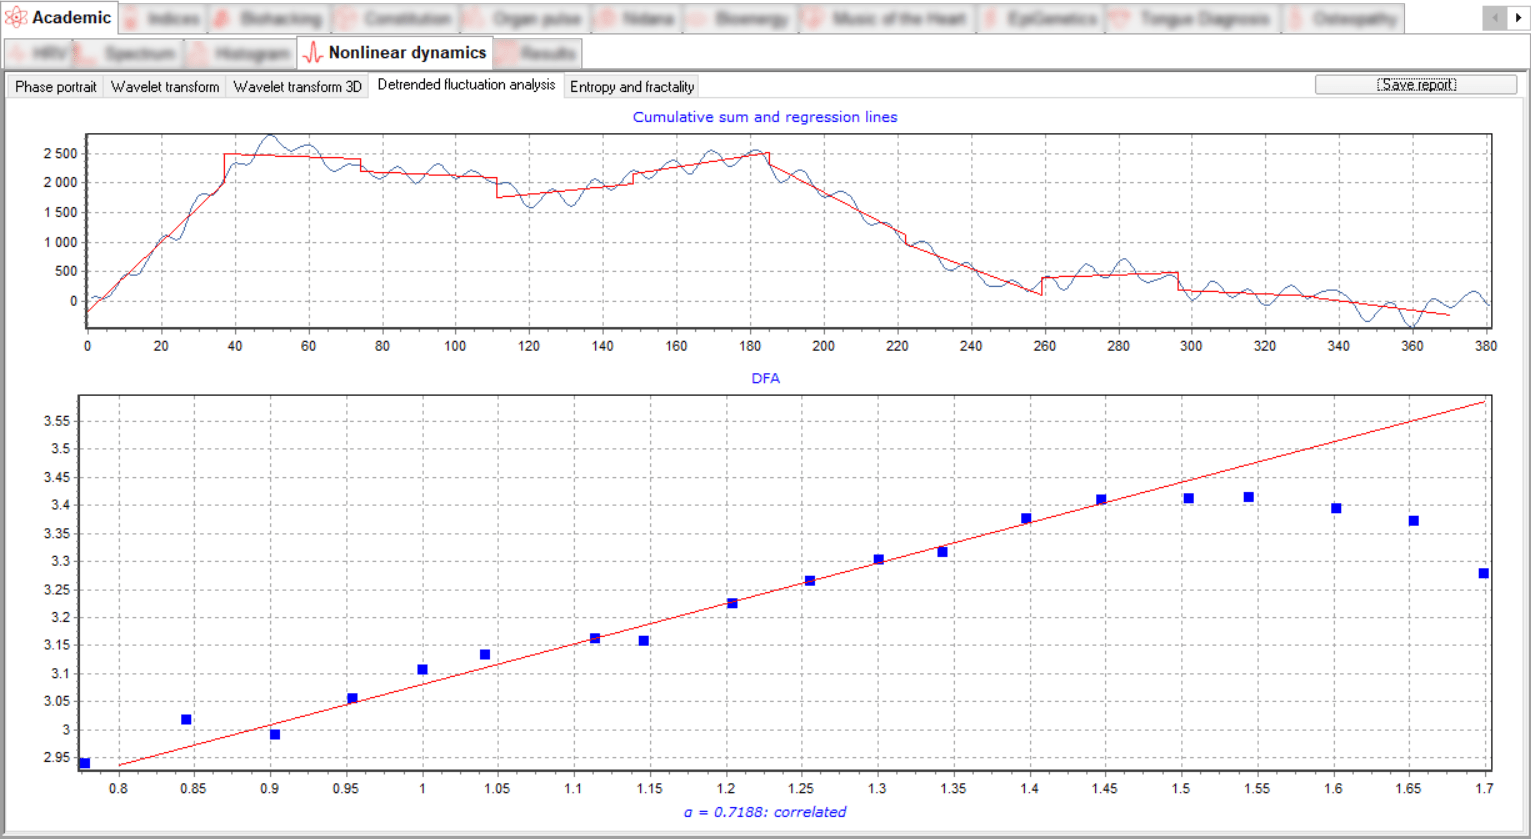
The DFA coefficient α can be interpreted as the noise index of the underlying data set. Larger alpha values indicate greater correlation at different scales, while smaller values indicate less correlation and, in a sense, more chaotic and random data. DFA analysis makes it possible to detect the self-similarity properties inherent in time series and also to avoid artefact trends.
The heartbeat becomes more chaotic as it is subjected to increased acute stress caused by physical exertion. For example, DFA α drops below 0.75 at the aerobic threshold and below 0.5 at the anaerobic threshold.
Detrend Fluctuation Analysis is presented in two graphs.
The upper graph shows the first stage in the calculation of the DFA coefficient α - the cumulative sum is calculated and the main trend is identified by regression lines.
The lower graph shows the points of deviation from the regression on various scales and the regression line along them, in logarithmic scales, the angle of inclination of the line corresponds to the coefficient α.
The fractal dimension is an indicator of the complexity of the process, the magnitude of which makes it possible to predict the behavior of the system and diagnose unstable states. The application of a non-linear dynamic approach allows us to assess how the study system functions (regularly or irregularly, and if irregularly, to what extent) and to determine the complexity of its dynamics.
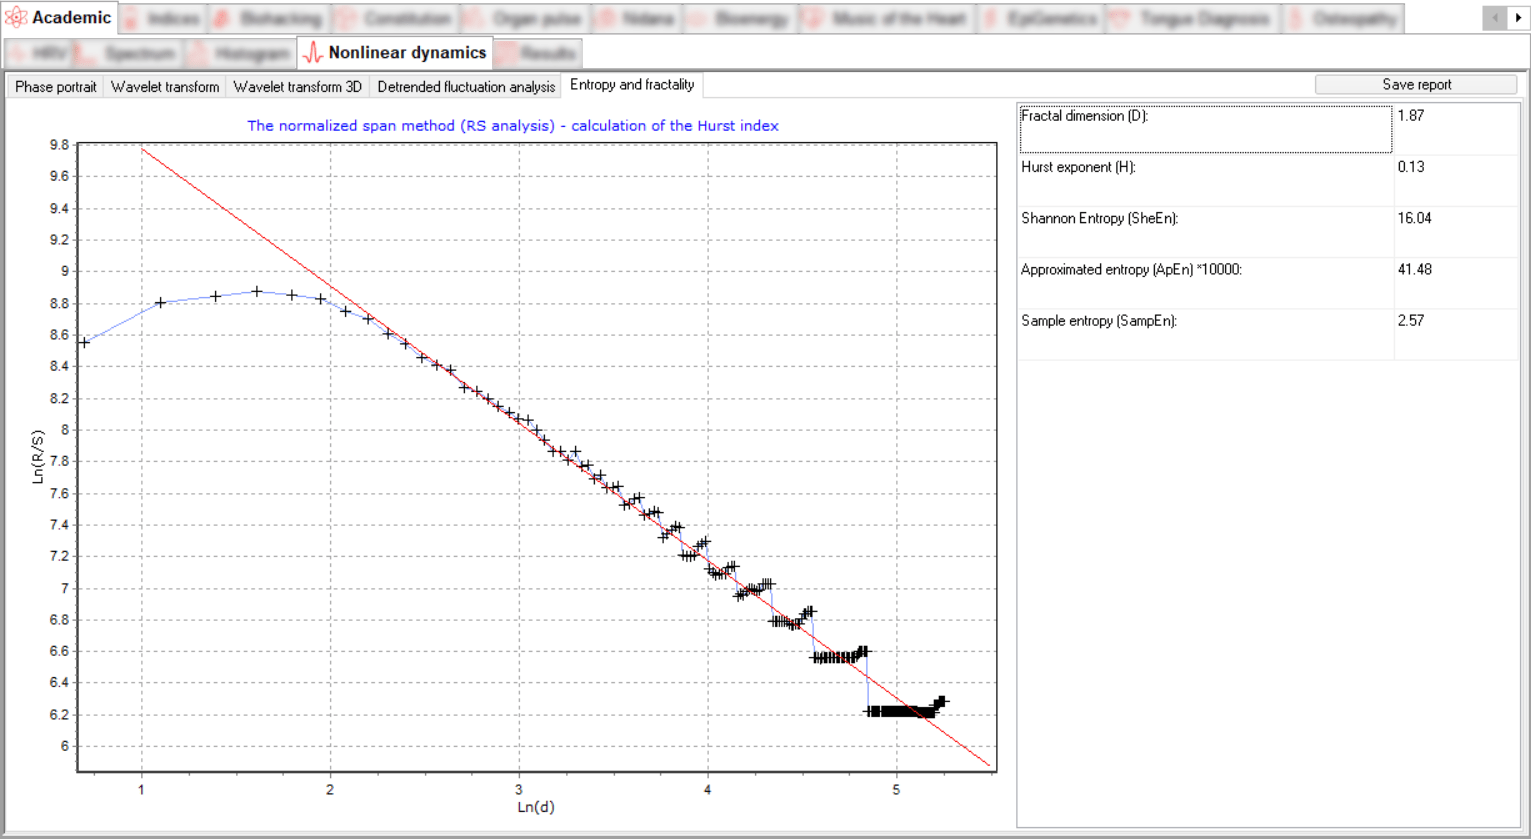
The Entropy and Fractality section contains a graph of the analysis of the fractal structure of the time series in double logarithmic coordinates and a regression line whose slope corresponds to the Hurst indicator.
The Hurst exponent H is used as a measure of the randomness of time series data. It estimates the autocorrelation of time series and the rate at which it decreases with increasing time between pairs of values. It quantifies the relative tendency of a time series to either strongly regress towards the mean or to cluster in a particular direction.
Shannon entropy expresses the uncertainty in the realization of a random variable. Thus, entropy is the difference between the information contained in the message and the part of the information that is exactly known (or well predictable) in the message.
Approximate entropy (ApEn) characterizes the degree of complexity of the signal. The more pronounced the regular component of the signal, the lower the value of this measure, and vice versa.
A significant decrease in entropy is most often accompanied by pronounced clinical manifestations of a negative prognosis of the disease or its negative dynamics. Low entropy indicators in combination with a decrease in vagal activity accompany the defeat of the autonomic nervous system in diabetes mellitus and the formation of polyneuropathy.
The Sample entropy (SampEn) is a modification of the approximate entropy (ApEn) used to estimate the complexity of physiological time series of signals diagnosing morbid states.
Who will benefit from using this module?
The Nonlinear Dynamics software module will be useful in scientific research as well as in the practice of all professionals using the principles of evidence-based medicine and wellness counselling.