
User manual for a hardware and software kit "VedaPulse home"
Program installation
The latest version of the distribution package "VedaPulse Home" is on the website http://vedapulse.com/download/
To install the program, download the installation file, run it and follow the instructions of the program.
Minimum system requirements:
- Processor with a clock frequency of 1 (GHz) or higher.
- RAM:
- Windows7/8/10 — at least 1 Gigabyte (GB) for 32-bit system and 2 GB for 64-bit systems.
- Free hard disk space:
- to install the program - at least 100 MB.
- to work - at least 10 GB.
- Video card - NVidia GeForce 8000+ or AMD Radeon 9600+, VGA, RAM 512M
- The presence of one free USB 2.0 port
Getting started with a hardware and software kit "VedaPulse Home"
Add a new client. This can be done in two ways:- Click «+»
- Select from the menu: Clients/Add new client
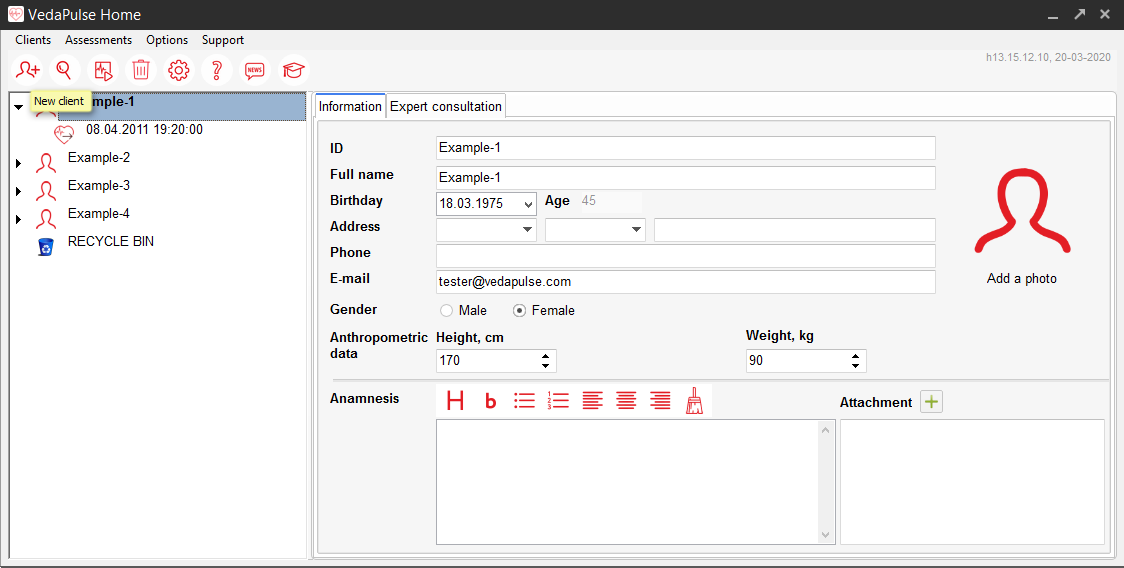
The client card will open - the Information tab. Fill it.
Field ID displays the client card in the list on the left.
If Privacy Law is applicable in your country, do not use ID field to enter full client name to ensure privacy.
Field Name allows you to fill in the information tab automatically Results and Conclusion.Fields: Gender, Age, Height, Weight are used by the program to calculate the integral index Health level in the Results/Indices tab.
The remaining fields are optional.
Conducting assessment
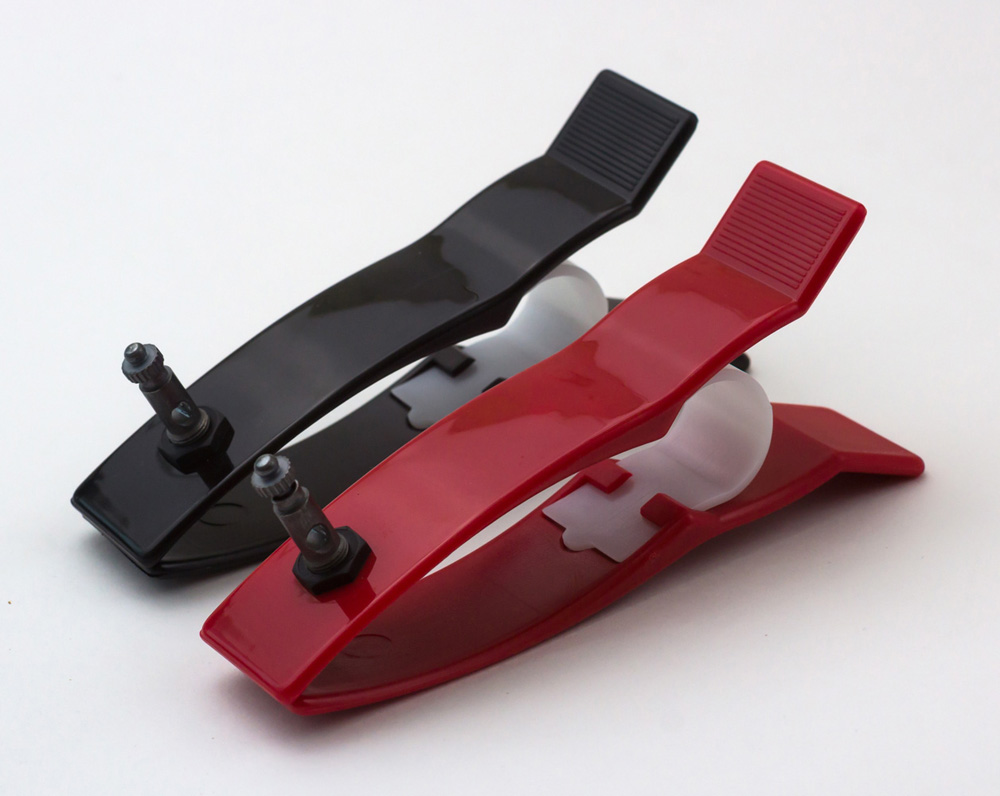
Connect the electrodes to the wires of the signal cable. Look at the color of the plastic tips located at the ends of the wires.
Note. Previously released devices were staffed with red and black wires.
Connect the wire with the red tip (or red wire) to the red electrode.
Connect the wire with black tip (or black wire) to the black electrode. Secure the cable with the screw.
Note. The devices of the first issue is partially staffed with yellow and green electrodes. In this case, the color of the electrodes is not important.
Connect the device to the USB port. Do not use any USB hub. Only direct connection to an USB port on the computer is valid.
Put the electrodes-pins on the wrists of the client. Electrode of the red color for the right hand, and the black - for the left. Or focus on the color of the wire or plastic tip, depending on what set you have. In electrocardiography the electrode location, when they are placed on the wrists, is usually called the first lead. Hereinafter goes another scheme - the second lead - it is described when it should be used.
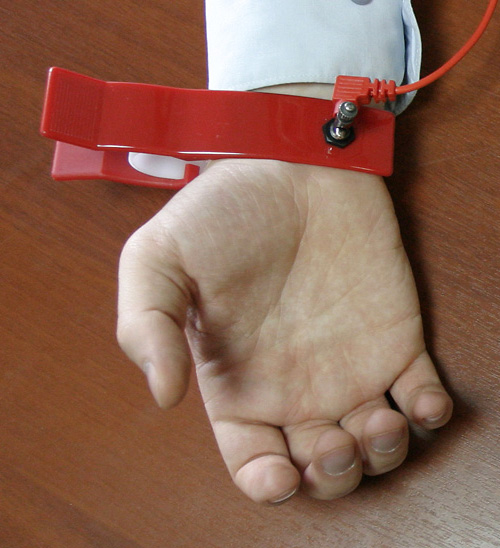
To improve the conductivity of the metal contact pads of the electrodes apply a special gel for ECG or simply moisten wrists with water in areas that will fit these contacts. Do not use distilled water - it is a poor conductor. It is better to take normal water from the tap.
The best position of the client during the record is lying on the back on the couch. Also valid position is sitting in a comfortable chair. Make sure that nothing impede the quality of contact of the electrodes and the skin surface. For example, if the wrist is too close to the body, the contact can be broken by the slight hand movement. We recommend placing small pads under the forearm so that the electrode does not contact anything: couch, chair arms, body, etc.
Click Assessment/New assessment or click the button «>» (blue triangle).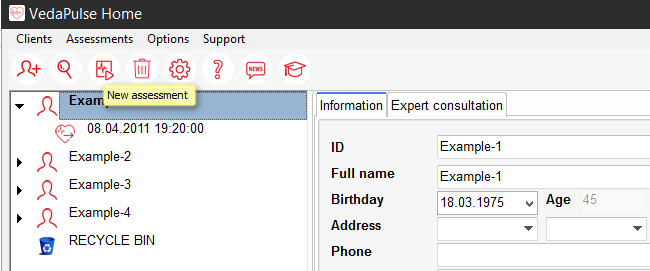
Monitoring
The window Monitoring parameters opens, it is designed to adjust time of recording. By default, the program offers 5 min. This time is optimal for the analysis of Hearth rate variability (HRV). Less time will not allow to calculate the LF-range with spectral analysis correctly, and more time could increase the risk of registration of transient effects on heart rhythm. It is recommended to accept this time, if there is no particular meaningful reasons to install a different time. But remember that it is correct to compare results only of the assessments of one duration.
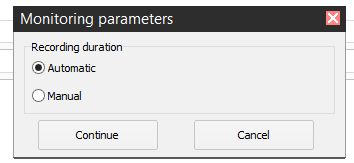
After pressing the button Continue the window of the ECG signal registration appears.
Some time keep watching of the ECG signal on the monitor screen. Ensure quality signal. When the signal is low, check the quality of the gel or moisture. By the way, if after working the gel is not removed, then it dries out and forms a crust, which subsequently degrades the electrical contact. It is therefore important to wash off the gel with a wet sponge and wipe the contacts of the electrodes dry after working.
If the signal contains a lot of noise, then disconnect the laptop from the network and use only battery of the laptop. In any case, do not proceed to the next step until you are sure in the quality of the signal.
If the signal is low and contains a strong noise, we use the second lead: the red electrode on the right wrist, and the black on the left ankle. In this case, you may again need to use the gel or additional wetting for the contact points at the ankle.
Strong pollution of the signal with noise happens when working in areas with large numbers of working appliances, bad wiring in the room, proximity to power cables, power lines, or when working on a computer with low level of protection against power line disturbances. Also the dry air in a room, the use of synthetic or wool clothing, as the client, and the specialist conducting the examination - all this creates an electrostatic field, which becomes a source of interference.
Usage of a second lead usually increases a signal thrice. And together with the using of the laptop on the battery allows you to conduct a qualitative assessment even with very high noise level.
Use of the second lead (the red electrode on the right wrist, and the black on the left ankle) and passing power on the laptop battery is recommended always when there is a doubt in the quality of the signal. This way you will avoid an appearance of artifacts on the record and the need of manual editing after recording.
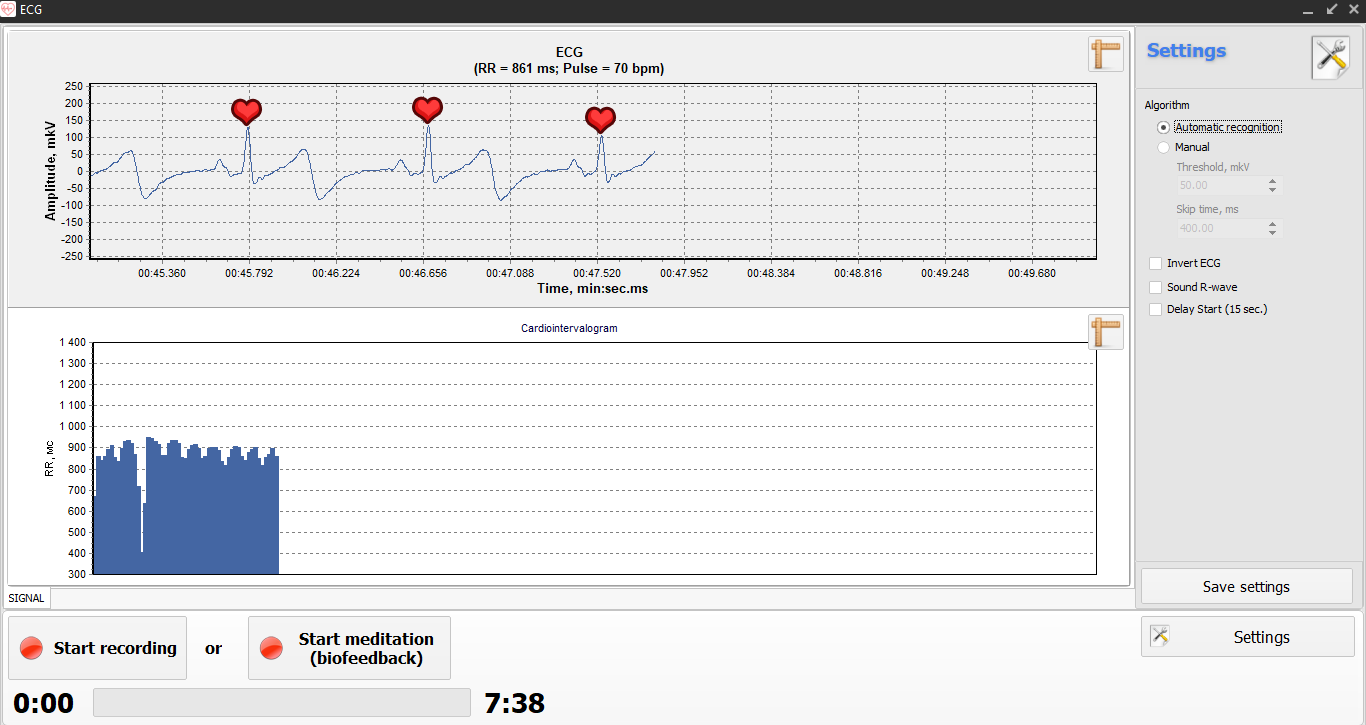
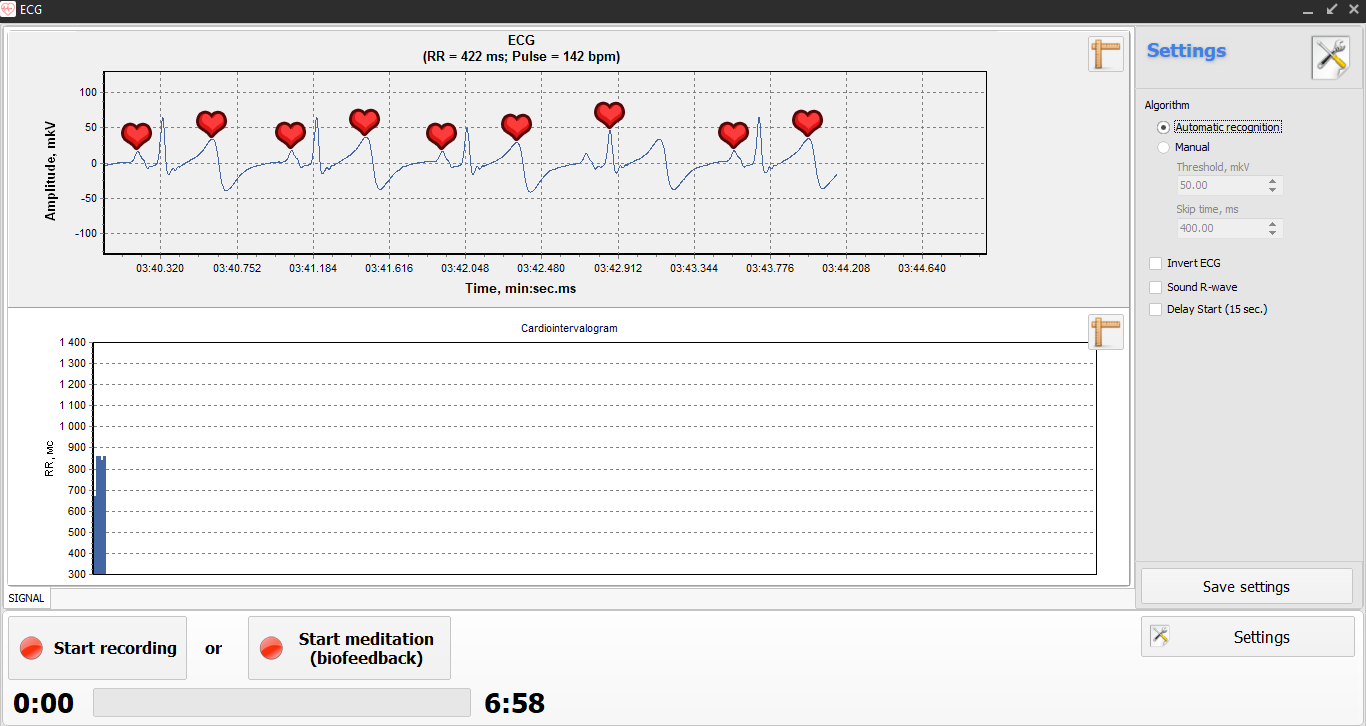
Please, note, the program automatically adjusts the scale. You can wait for optimal display scale, and uncheck the Automatically. This will lock the scale and simplify visual inspection of the signal. You can also manually adjust the scale, putting the maximum and the minimum. After adjusting the zoom level of the signal on the screen, go to setup of the allocation of R-waves. For this purpose, adjust the Threshold. This is the top-most window in the settings located on the right side of the screen. On the axis of ordinates define the R-wave amplitude in mkv and roughly divide it into two. The resulting figure should be filled in the Threshold. Watch the program recognizing R-wave. At each R-wave an icon-heart should appear.
The program has two modes of signal recognition: Automatic and Manual. By default, the Automatic mode is set. Typically, in just a few seconds after receiving the signal, the program automatically configures and starts to recognize R-waves. Each peak will be marked with a heart-shaped icon. Keep an eye on this process for a few seconds. Make sure R-waves are detected correctly. There should be no omitted R-waves. Heart-shaped icons should not appear on other waves – P and T.
If no errors are seen within 10-15 seconds of recognition of R-waves, you can start to record the signal. In case it is not possible to receive good quality of R-waves detection, switch to the Manual mode. The switch between the modes is in the upper right corner of the window.
After switching to the Manual mode, adjust the Threshold value. For this purpose, configure the Threshold value. This is the top-most window in the Settings located on the right side of the screen. On the axis of ordinates, define the R-wave amplitude in μv and roughly divide it in two. Insert this number in the Threshold window and press Enter. Watch how the program detects R-waves - each R-wave should be marked with a heart-shaped icon.
To start the record, you need to click the “Start monitoring” button. By doing so, you will initialize the timer under the “Start monitoring” button.
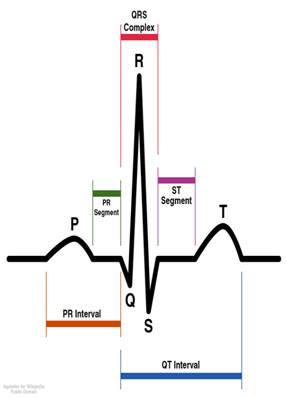
Carefully review the scheme and learn how to identify R-wave on ECG signal visually.
When the gaps - if the icon-heart skips a separate R-wave - reduce the value of the threshold.
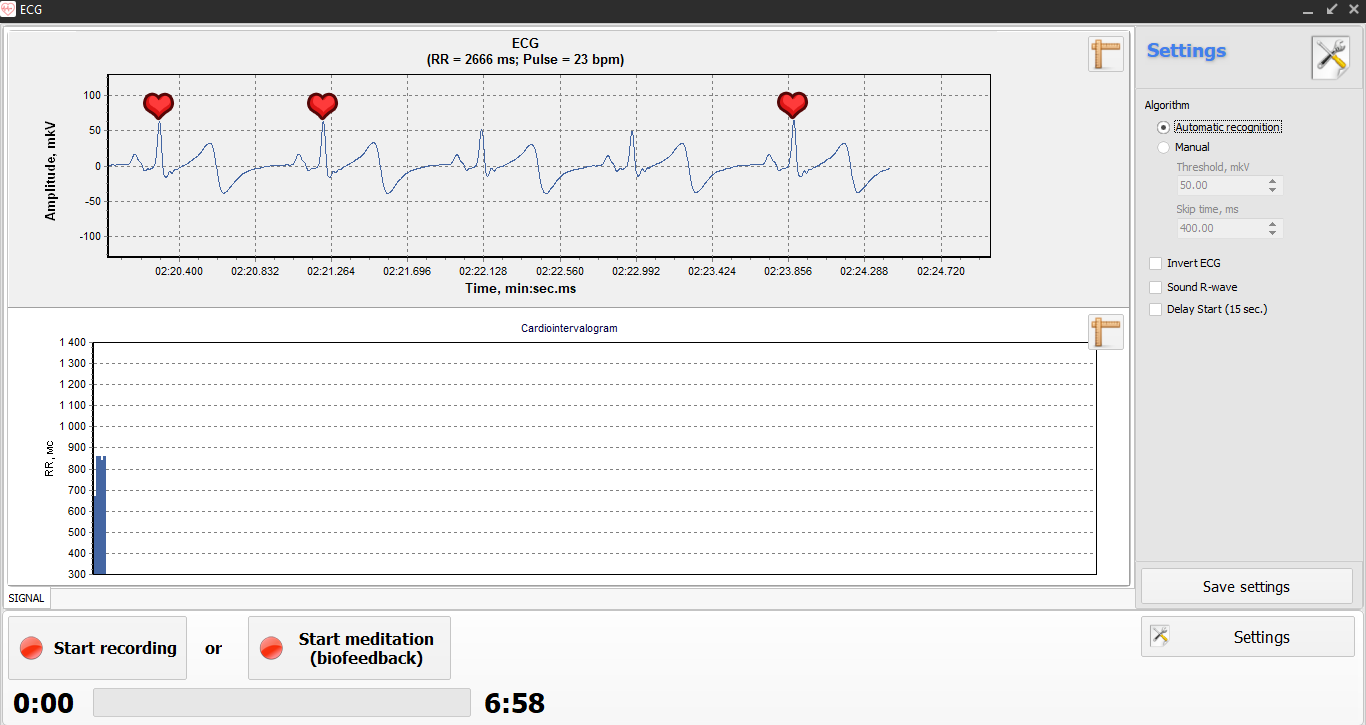
If the icon-heart appears on other waves, except R-wave, one should increase the value of the threshold voltage.
The R-wave amplitude depends on the individual electrophysiological parameters of the client. If the threshold value has to be reduced below 25 mkv to achieve the allocation of R-waves, it's a compelling argument to the second lead, as this indicates a low signal level and increases the risk of artifacts. But, of course, the main reason for the decision about the need to move on to the second lead is the fact that it is not possible to achieve a stable allocation of R-waves by setting the threshold voltage. If, despite all efforts artefacts appear, then proceed to the second lead. It often happens that it is easier to increase the useful signal than to fight the noises that lead to the appearance of artifacts. Important: it is not necessary to eliminate the noise completely, it's only important that this noise is not scored useful signal and does not interfere with the stable allocation of R-waves.
Take your time. Adjust quietly, so as not to affect the emotional state of the client. Before starting recording, the participant has to give a few minutes to sit quietly to calm down the heartbeat. But if the specialist hastes and is nervous in preparation for the beginning of the assessment, then his mood can be transmitted to the client. It is important for the specialist to act confidently and calmly to minimize the impact on the client. But don't fall in to another extreme - no need to enable slow meditative music to immerse the client in relaxation artificially. The music has a great influence on people and can considerably change the normal functional state. If the task is to estimate the normal functional state, then eliminate all the factors that can change it. The best time for assessment is the first half of the day, it is undesirable for the client to experience a severe famine. It is also important that the client the day before the survey did not take alcoholic drinks, did not feel any strong emotional and physical exhaustion in the previous days. But if the client has violated any of these terms of preparation for the assessment, but did come, it makes sense to conduct a survey and repeat it in future to be able to compare the results of the assessment in the normal state and under the influence of the corresponding stress factor. This will give additional information to assess the impact of the lifestyle that leads the client, its functional state.
After achieving quality settings of R-wave, you can save the settings by clicking on the button Save settings. Thereby you will simplify configuration when the survey is conducted in this client next time. After saving settings, you can go to the assessment's record.
To start recording you need to click on the Start recording. Then at the bottom of the screen will turn on a timer that displays the recording duration. Simultaneously with the timer a graph of Cardiointervalogram will start and display, it shows in real-time mode changing of the cardiac cycle's duration.
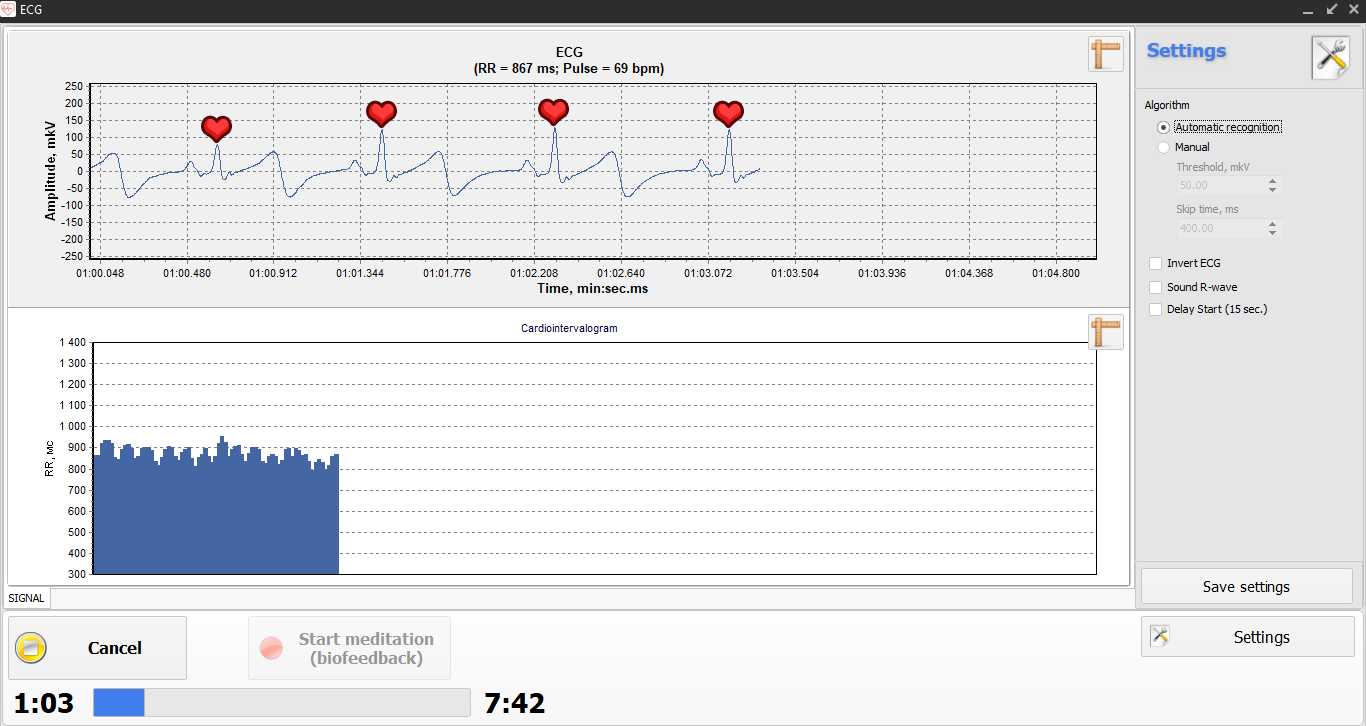
Observing this graph, a specialist in the process of recording can assess the stationarity of the recording, that is, to assess how stable the functional status of the client is. The monitoring of the recording allows to stop the assessment to eliminate the cause of changes in the functional state of the client. Also, on the graph one can dynamically track the result of any impact on the client. Use this in the case when the purpose of the assessment is not an estimation of the functional condition of the client, but the evaluation of the degree of influencing factor. But remember that if you operate on the client during the recording and change its functional state, these entries will be suitable mainly for visual assessment of the dynamics of cardiointervalogram, but not for automatic HRV-analysis by the program. Because the algorithms of HRV-analysis work only on stationary records, when the client does not change the functional state during the test.
During the recording the client should not talk, sneeze, cough, take deep breaths, experiment with the rhythm of breathing or eating, chewing gum, swallowing saliva, making any mental effort - that is, you must not perform any actions that may affect the heart rhythm. In case of violation of these rules, stop recording, delete it and re-assess this client.
In the case when the aim of the assessment is to examine the effect of any factor, these rules can be changed according to the task.
Note. To delete an entry, use the command Assessment/Delete assessment.
Meditation (biofeedback)
Expert extension "Flower of the heart"
After adjusting the ECG signal, click on Start meditation (biofeedback), the timer will start in the same way as in the monitoring mode, but after 15 seconds you will be redirected to the Flower tab automatically. It is important for a participant to stay in a normal, relaxed state during these 15 seconds, because this is the period for recording of a basic state (the training will be based on this data). If you hasten and do not take time for preparation, the state of tension, which the participant felt during preparation stage, will be registered. Before clicking the Start the meditation (biofeedback) button, it is important to ensure that the average heart rate (HR) is relatively stable. Heart rate can be monitored at the top of the screen, as well as on the cardiointervalogram graph at the bottom of the screen.
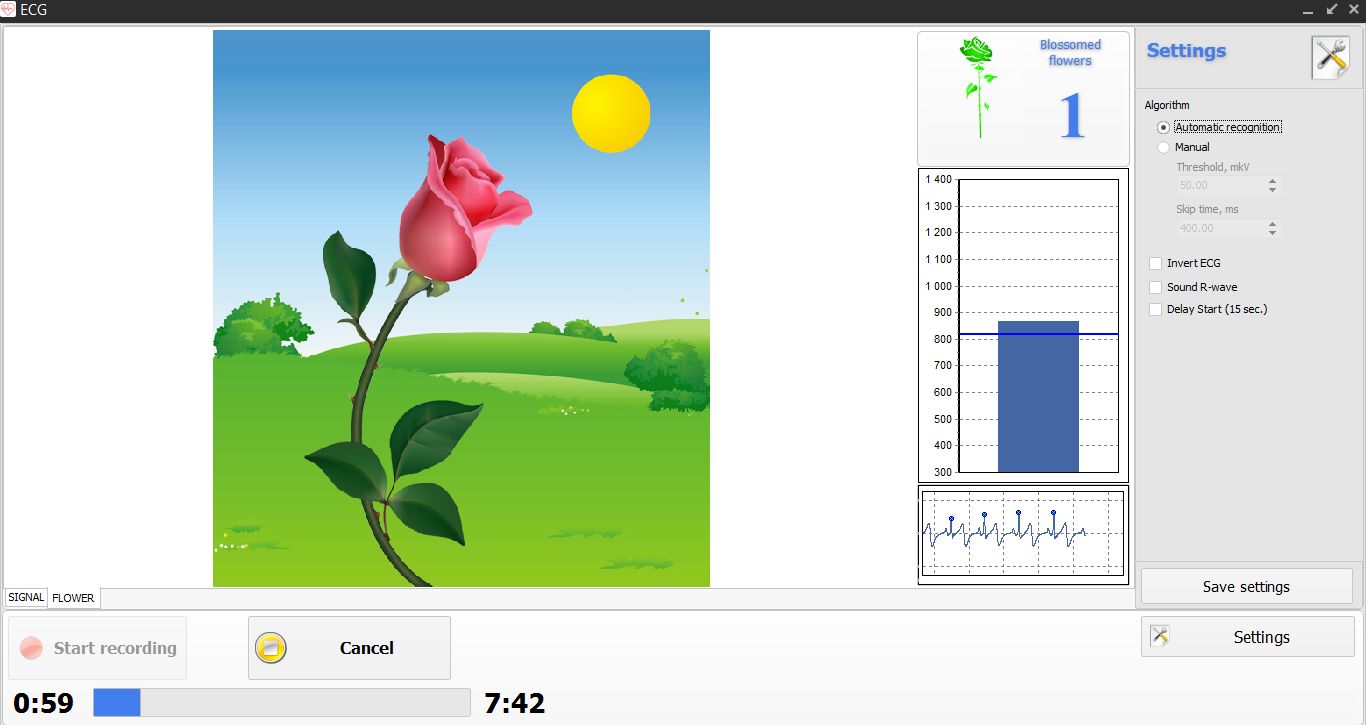
The Flower tab is the basic mode of meditation (biofeedback). There is a picture of a rose flower in the left part of the screen. Right part of the screen shows a graph with changes in the heart rhythm. Bright blue horizontal line in the center of the graph indicates the average heart rate (HR), calculated by the program during the first 15 seconds of the recording. This graph is somewhat similar to a glass of water. During the meditation session (biofeedback), the level of "water" is constantly changing, reflecting the change in the duration of cardiac contractions. With increased duration of the cardiac cycle, the level goes up, and with reduced duration - it drops down. Lower level indicates mobilization (tension), and the increased level indicates relaxation. With the relaxation the flower starts to blossom.
The more flowers participant will be able to dissolve, the better your result will be. There is a counter of opened flowers at the top of the screen. During the training, one may look at the flower or at the fluctuations of the "water" level, all up to the person’s preference.
The aim of the training is to learn the art of relaxation and to start the process of self-regulation that leads to the self-healing of the body. In “VedaPulse", it is done by learning "proper" breathing technique. In order to relax and relieve stress, you need to use abdominal (diaphragmatic) breathing.
The program helps to learn how to feel your breath, the beginning of the inhalation, the end of the inhalation, the beginning of exhalation, the end of exhalation, small pauses between inhalation and exhalation. Breath is like an ocean, inhale and exhale – like waves of high and low tide.
Tune the body for breathing exercises, as a musician tunes his instrument before a concert. Remember a very simple rule, a very simple method: learn to draw your abdomen in slowly and gently at the end of exhalation and try to prolong this phase.
While doing the exercises in the right way, a person will feel relaxation and the level of “water” in the glass will rise, the top line of its fluctuation will be above the "water line". The flowers will be opening one after another.
In the result of haste or too long exhalation, the rose stops blooming. To switch from the chest breathing to diaphragmatic one, the key factor is to learn how to draw the abdomen in at the end of exhalation. Do not think about the inhale; do not pay attention to it. Your "area of work" is exhalation. After the air fills the lungs, exhale calmly and slowly and start drawing your belly in just like squeezing the air out. When lungs empty and you are ready to take a next breath, the stomach expands and moves forward to make a diaphragmatic breath. This will allow you mastering the correct diaphragmatic breathing nice and easy, slow breathing and get the effect of relaxation.
In addition, control respiratory waves on the cardiointervalogram chart. To do this, click on the Signal tab. The switch between the Signal — Flower tabs is located in the left bottom corner of the screen.
In addition to visualization of fluctuations of the heart rate, there is an opportunity to sound your heartbeat. To activate this function, you should enable the option “Sound R-wave” in the Settings of the Signal registration window. Hearing the beating of your heart is a powerful way of influencing the heart rhythm. This biological signal may even lead to entering the state of trance.
Besides learning the diaphragmatic breathing and ability to enter the state of trance by using the sound signal, Biofeedback mode can be used to learn any form of auto-training. Description of auto-training techniques is beyond the scope of this guide. Focus your attention only on the fact that using visual and acoustic channels of biofeedback provided by the VedaPulse software, the user can successfully combine a variety of techniques: meditation, auto-training, breathing exercises, etc. If used by coaches, VedaPulse software also offers tools for the objective monitoring the dynamics of the physiological state of a client.
Gaming Biofeedback Session
After adjusting the ECG signal, if you click on “Start meditation” > “Bike race”, a new window with biofeedback session will automatically open on the screen.
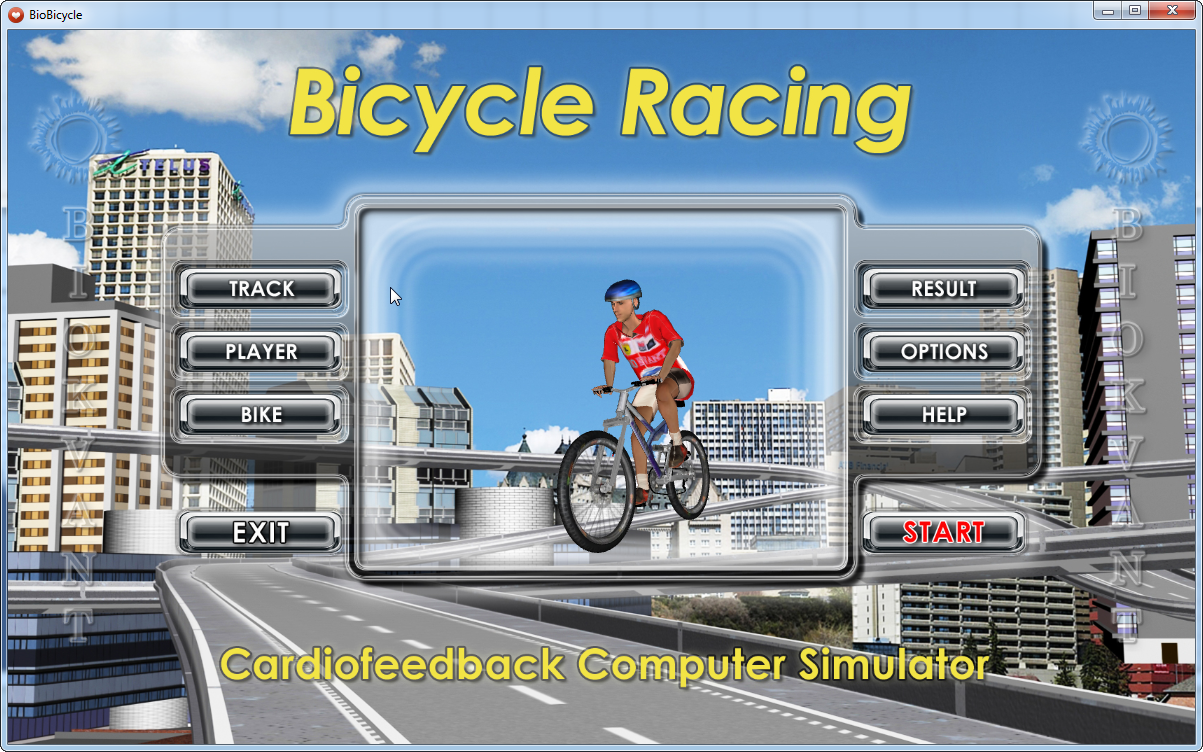
“TRACK” button allows you to select either a city or a countryside route.
“PLAYER” and “BIKE” buttons allow you to choose colors of the clothes and bike respectively. “RESULT” button allows you to monitor the results of the players.
“OPTIONS” button is used to choose players, language, music, single or two-player game. For two-player game, your PC must be connected to the local network. When choosing a single game, you compete with the previous result. That is, in your next race, you will compete with your best personal result of the previous race.
When you click the “START” button, you will see the starting line. To start the race, you should press the Space bar on the keyboard. Before you do this, rest in a relaxed position for a few minutes prior to starting the training session. This will calm down the heartbeat.
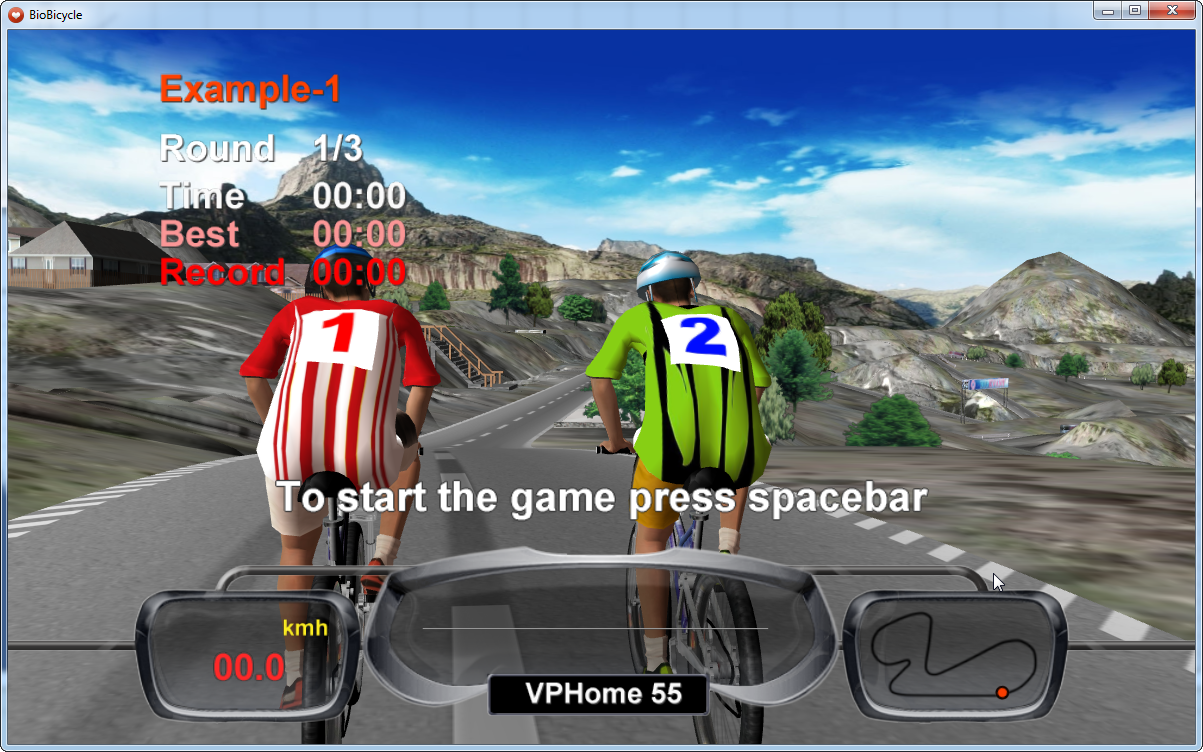
During the race, the following information is displayed at the top left corner of the screen:
Round - Number of the lap, which the player currently rides (it is necessary to finish 3 laps).
Time - time elapsed since the beginning of the game.
Best - This is the time of the best previous result of the player. It is displayed as your opponent’s time.
Record – the best time on the track that was registered on this computer.
The following parameters are displayed at the bottom part of the screen:
Speed – depends on the degree of relaxation achieved by the player and reduction of the heart rate.
Heart rate (numbers after “VP Home” logo).
Schematic view of the route shows the starting point (white dot) and the other two points showing the location of the player and the opponent (red dot is the player, blue — opponent).
During the game a certain graph is displayed in the center of the screen, right above the VP Home logo. It is called cardiointervalogram. It reflects changes of the heart rhythm in real time.
The aim of the gaming biofeedback is to achieve maximum relaxation and reduce heart rate (HR). When the heart rate begins to slow down, the player takes lead. When the heart rate starts to increase, your opponent takes the lead.
Assessment results
The Assessment results includes several tabs: HRV (heart rate variability), Indices, Balance, Atlas, Music of the heart, Results.
HRV (heart rate variability)
The tab HRV contains the following graphics: ECG, Cardiointervalogram and Scattergram.
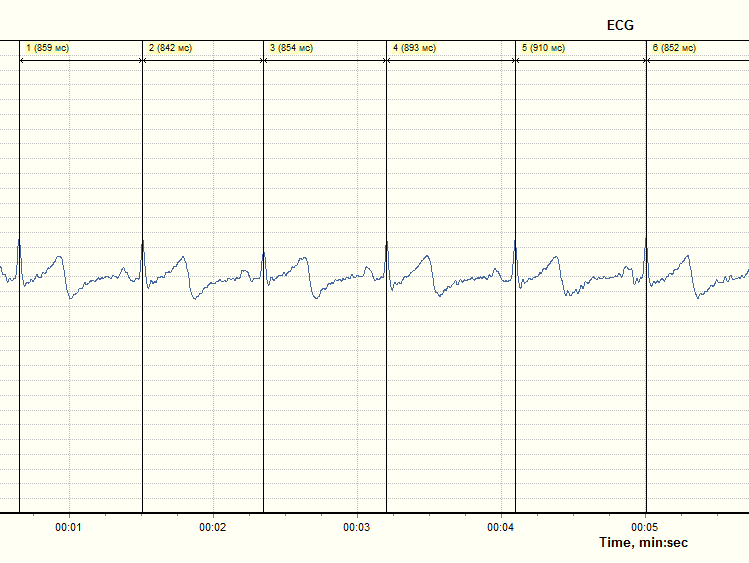
ECG
The graph ECG contains the initial electrocardiographic signal of the heart,here the program automatically puts the markers on the peaks of the R-waves. Those places on the ECG that during the recording are indicated by the icon-hearts, after the recording are highlighted with markers - black vertical lines. Right on top of each marker are number and duration of RR-interval in milliseconds (MS).
Cardiointervalogram
Cardiointervalogram it is a chart showing the successive changes in the duration of R-R intervals, i.e. it is a graph showing a sequential process of changing heart rhythm measured in milliseconds (MS) - tachogram of the heart. When the heart rate is declining (slowing of heart rate), then the graph is growing up, and increased heart rate leads to the decrease of the curve.
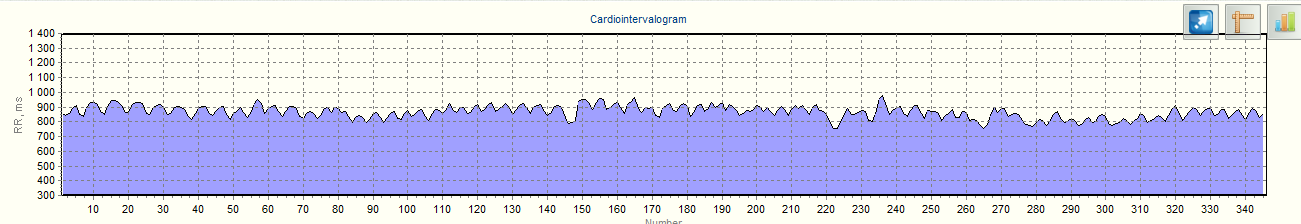
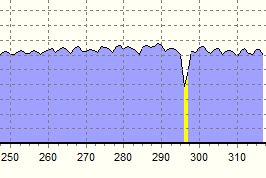
This chart clearly shows both - places of arrhythmias and artifacts - zones where the program was unable to find R-waves automatically due to the presence of high noise level, or a temporary loss of contact caused by the client's movements.
The program automatically finds zones of arrhythmias and artifacts, highlights them in yellow. To do this, it compares the duration of adjacent RR-intervals and if the length differs by more than 20%, then highlights them in yellow.
In "VedaPulse Home" we use manual editing of artifacts. With proper training to conduct the assessment, the number of artifacts is minimal and there is no a great difficulty editing them if you acquire some experience.
Click with the left mouse button on the found artifact on cardiointervalogram, it brings you to a segment on the ECG record in the appropriate places for a quick way to edit markers.
A search of the zone requiring editing is easy to make on cardiointervalogram, and editing of markers is made on ECG.
In order to change the position of the marker hover over the item, press the left mouse button and move the cursor. Then release the left mouse button.
In order to remove the marker, hover over the cursor, press the right mouse button, click "Remove marker". To insert a new marker, click "Insert new marker"
In order to eliminate the interval from processing (for example, with arrhythmia), hover over the item, press the right mouse button, select "Exclude".
Indices
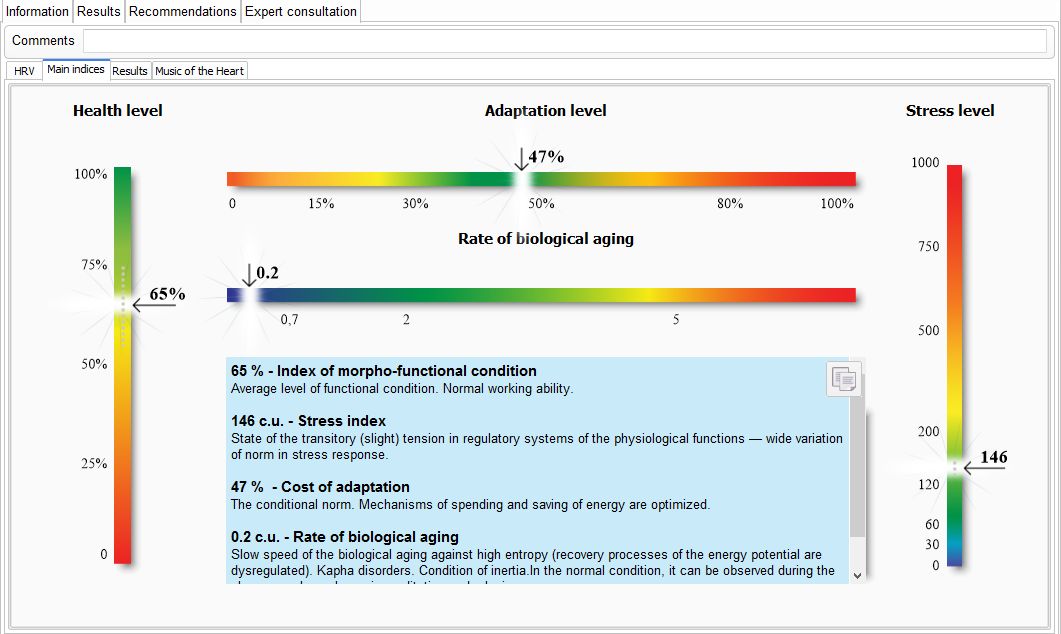
This tab contains:
The index of the morpho-functional status (Health level) is an integral index that takes into account the other major indexes.
Cost of adaptation - measure the ability of an organism to adapt to changing external and internal conditions.
Rate of biological aging of the hearth — the rate of deterioration of the heart muscle at the moment (at the time of inspection!!!, and not the General level of deterioration of the heart). This value depends on the ratio of the processes of mobilization and recovery.
The stress level of stressful tension (Stress Index) reflects the degree of influence of stress on the body.
All indexes have pop-up tips explaining their physiological significance.
Atlas
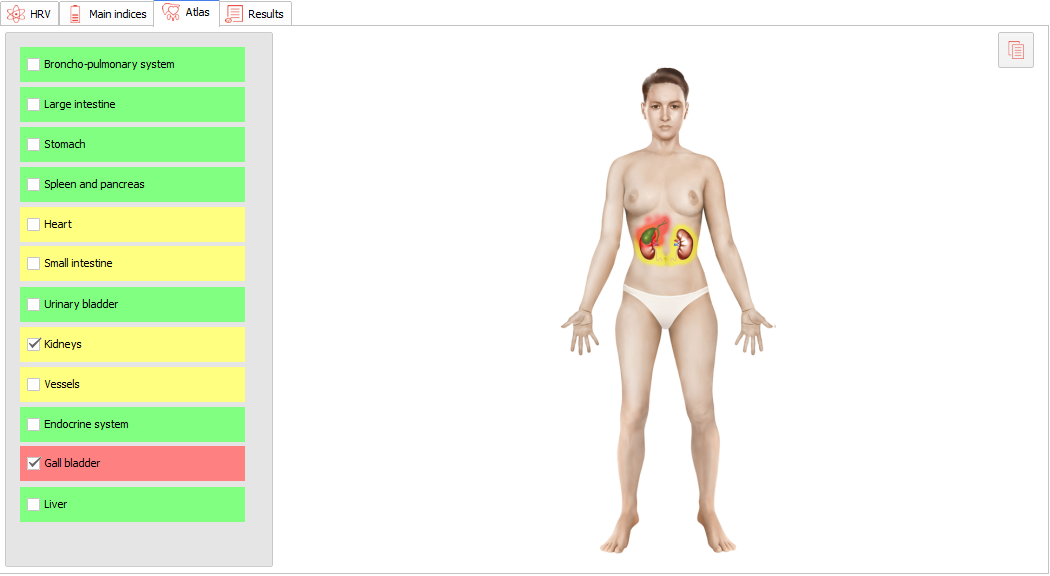
This diagram shows the current disorders in the mechanisms of regulation in a particular system or a particular organ. Around organs there is a pulsing glow that shows the state of energy in the body. Yellow markes the lack of energy (risk zone), red — excess (tension), and green markes the normal level of energy.
Music of the heart
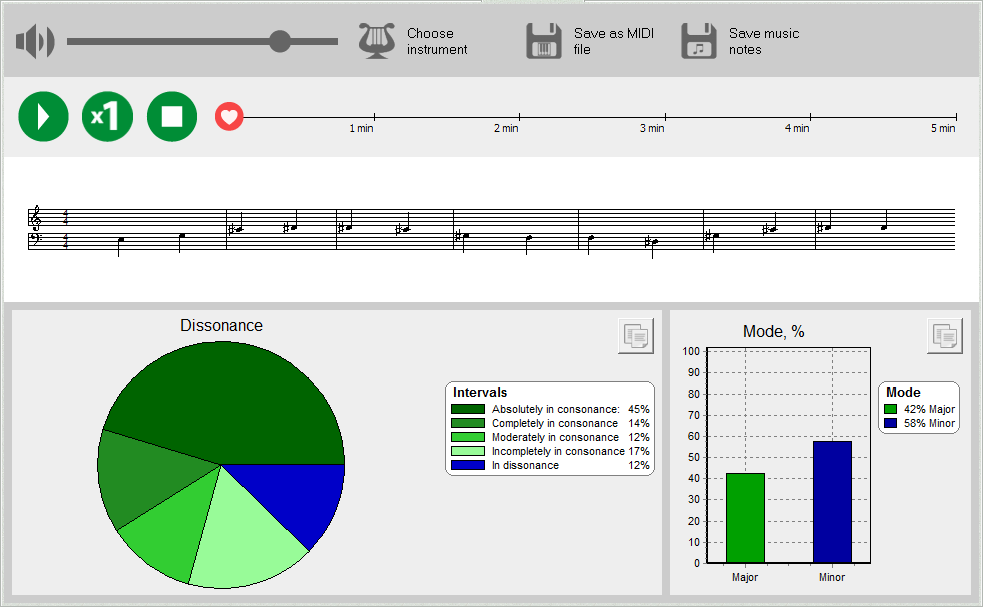
Designed to transform the recording of the heart rhythm in a piece of music that you can listen, save as an audio file or in the form of notes. One can use musical analysis here: to determine the percentage of consonant and dissonant harmonies, and a ratio of major and minor tonalities in the melody of the heart.
The fact that the laws of musical harmony and the laws of human health are United, has been known since ancient times (the Gandharva Vidya in Ayurveda, the doctrine of the Harmony of the spheres of Pythagoras and Aristotle in antiquity). This idea dates back to global philosophical principle — to the idea of the unity of the laws of the universe. So, the application of mathematical laws of musical harmony to assess heart rhythm looks quite naturally.
Results
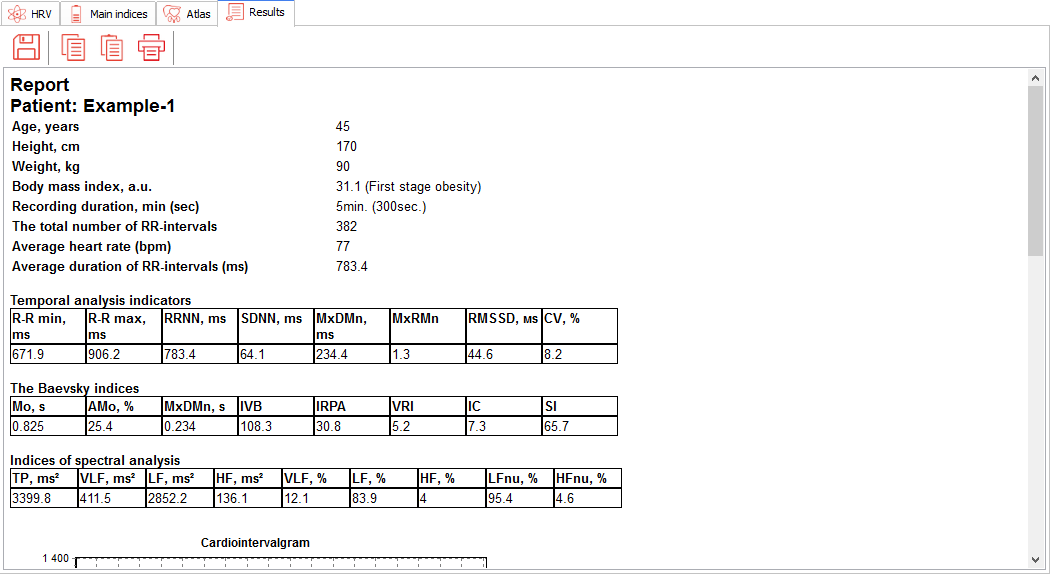
Automatically puts all of the data from the HRV, Spectrum, Histogram tabs into one document that can be saved in DOC, RTF or PDF format.
Recommendations
Recommendations section contains Conclusion tab. Recommendations section is getting filled out when you receive the recommendations from your physician, who uses VedaPulse Professional system through Expert Consultation module
Conclusion
The Conclusion tab is designed to visualise recommendations received from the physician using the VedaPulse Professional device through Expert Consultation module.
When you save the file of the Conclusion, you can use keyboard combinations such as Ctrl+c (copy), Ctrl+x (cut), Ctrl+v (paste). The final version of the "Conclusion" can be saved to a file in DOC, RTF or PDF format and edited later.
Expert Consultation
The Expert Consultation tab is designed for distant communication of the client and the specialist — the client sends assessment results from the program VedaPulse Home to VedaPulse Professional and receives recommendations from the VedaPulse Professional system.
To send the assessment from VedaPulse Home to VedaPulse Professional, you need to fill out the following fields:
- My email
- Physician's e-mail
After this, click Send assessment to the server.
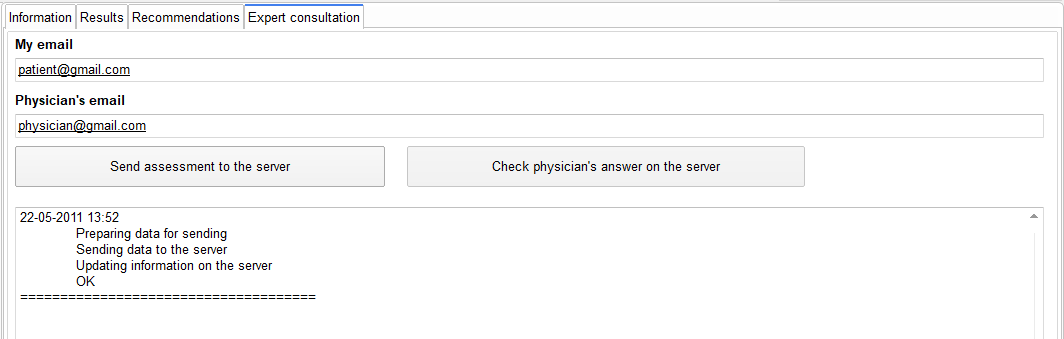
To check for physician's reply with recommendations, click "Check physician's answer on the server"
Note. Email is used only as an identifier, the mail server is not used. Only the test is passed via Internet, all confidential information contains on the user's PC.
Demo
While selecting Assessment/New assessment/Start in Demo mode, you will be able to see the ECG registration window, on which the program will simulate ECG signal. This record will not be saved upon completion. Its purpose is to show users the process of signal registration.
Technical support
Skype: vedapulse.support
E-mail: support@vedapulse.com
Tel.: +73833340179
Working time: Monday–Friday 5 a.m. - 2 p.m. (Moscow time).