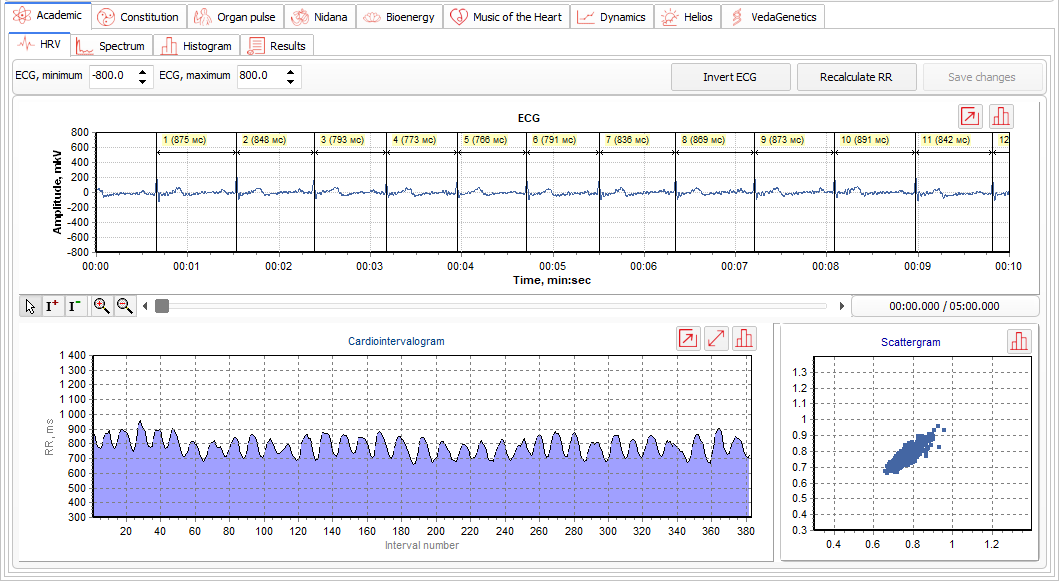
«Academic» is an expert module for the "VedaPulse Professional". Designed for analysis of indicators of heart rate variability (HRV) using algorithms approved by the European Cardiological Society and North American Society of Pacing and Electrophysiology (1996) and also the Commission on clinical diagnostic devices and apparatuses of the Committee on new medical technology of the Health Ministry of the Russian Federation (2000).

 *HRV
*HRV
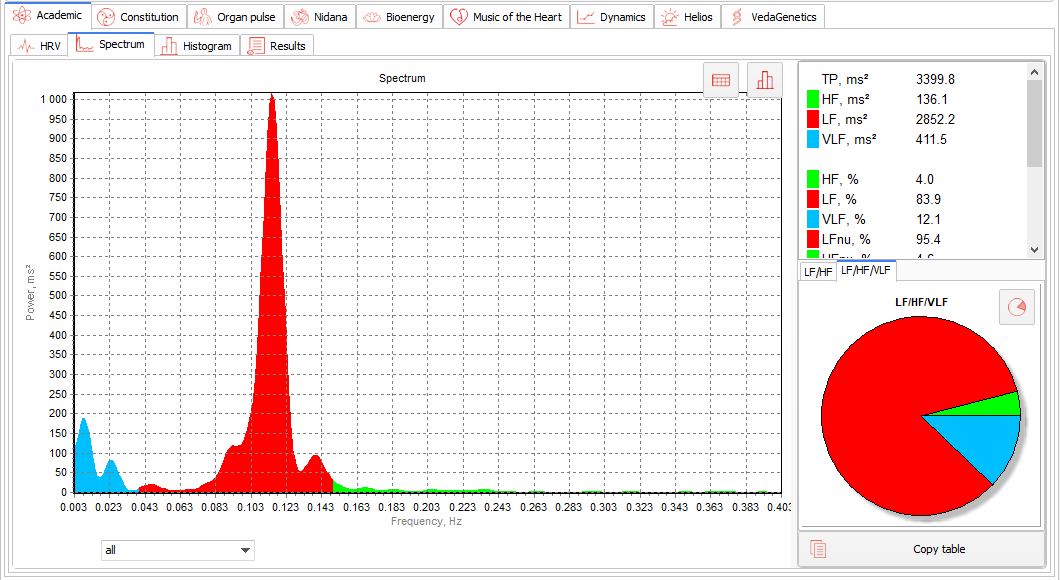
Spectrum is an analysis of the spectral Fourier transformation. This tab contains three graphs: graph of the absolute distribution of the power by the frequencies and two pie charts that show the ratio of the spectral components (VLF/LF/HF and LF/HF), and this table also provides the figures of absolute and relative indicators of all the spectral ranges.
 *Spectrum
The histogram is a graph of the distribution of the durations of RR-intervals. Also on this tab is a table with statistical indicators of heart rhythm. The table contains the following data: R-R av (an average interval between R-spikes) ms; HR (heart rate), bpm; R-R min, ms; R-R max, ms; MxRMn (a difference between maximum and minimum durations of cardio intervals), conventional units (cu); MxDMn, ms; Mode, sec.; AMo (mode’s amplitude), %; CV (variation coefficient),%; VIR (vegetative rhythm index), cu; SI (stress index), cu; IVB ( index of vegetative balance), cu; IRPA (index of regulation processes activity), cu. ; IC (centralization index), cu.
 *Histogram
Results is a summary report with all the data contained in the tabs: HRV, Spectrum, Histogram. This report can be saved in a Word document.
 *Results
"Academic" is designed for all professionals, who use methods of traditional medicine in their practice and consult on a healthy lifestyle.