
User manual for a hardware and software kit "VedaPulse Professional"

- Program installation
- Getting started with a hardware and software kit "VedaPulse Professional"
- Activation of the program
- Introduction to the subscription system of “VedaPulse” software.
- Before starting the assessment
- Conducting assessments
- Importing and exporting the data
- Assessment results
- HRV (heart rate variability)
- Spectrum
- Histogram
- Nonlinear dynamics
- Indices
- Constitution
- Meridians (Pulse of organs)
- Atlas
- Nidana
- Bioenergy
- Music of the heart
- Dynamics
- VedaGenetics
- Tongue diagnosis
- Iridology
- Osteopathy
- Thermography
- Biohacking
- Statistics
- Lifestyle
- Herbal Encyclopedia
- Aroma Encyclopedia
- Supplements Encyclopedia
- Diet
- Yoga
- TCM
- Physiotherapy
- Thermal therapy
Program installation
The latest version of the distribution package "VedaPulse Professional" is on the website https://vedapulse.com/download/
To install the program, download the installation file, run it and follow the instructions of the program.
Minimum system requirements:
- Processor with a clock frequency of 1.8 gigahertz (GHz) or higher.
- RAM:
- Windows7/8/10 — at least 2 Gigabyte (GB) for 32-bit system and 4 GB for 64-bit systems.
- Free hard disk space: to install the program - at least 200 MB.
- Video card - NVidia GeForce 8000+ or AMD Radeon 9600+, VGA, RAM 512M
- The presence of one free USB 2.0 port
Getting started with a hardware and software kit "VedaPulse Professional"
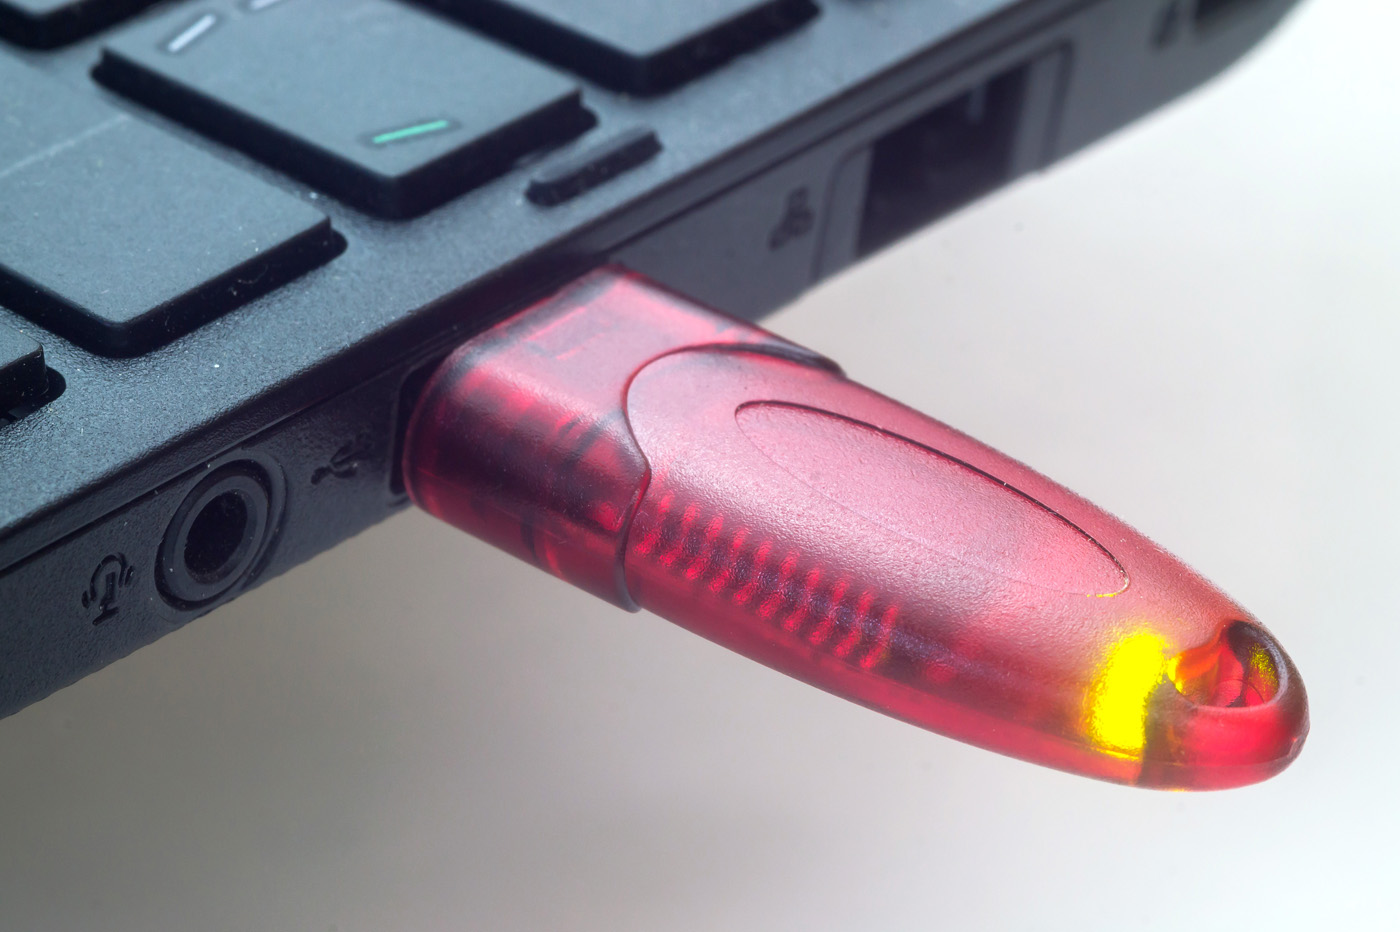
Insert the USB security key into the USB port of the computer.
Connect the device to PC using USB cable and run the program "VedaPulse Professional" on the computer.
After starting the program the USB key can be removed. It was only needed to run the program.
Activation of the program
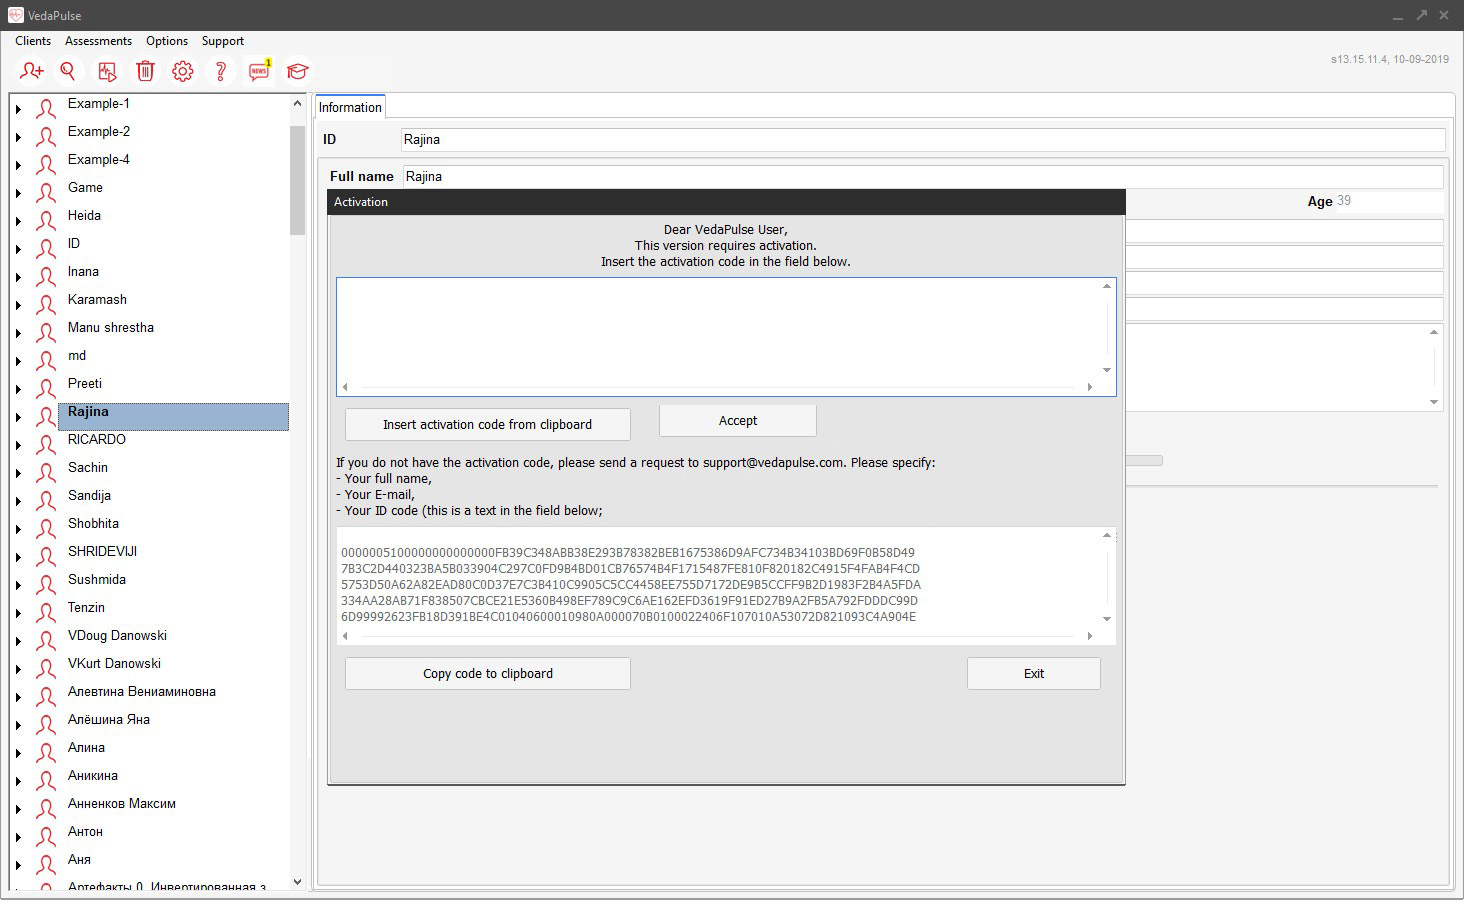
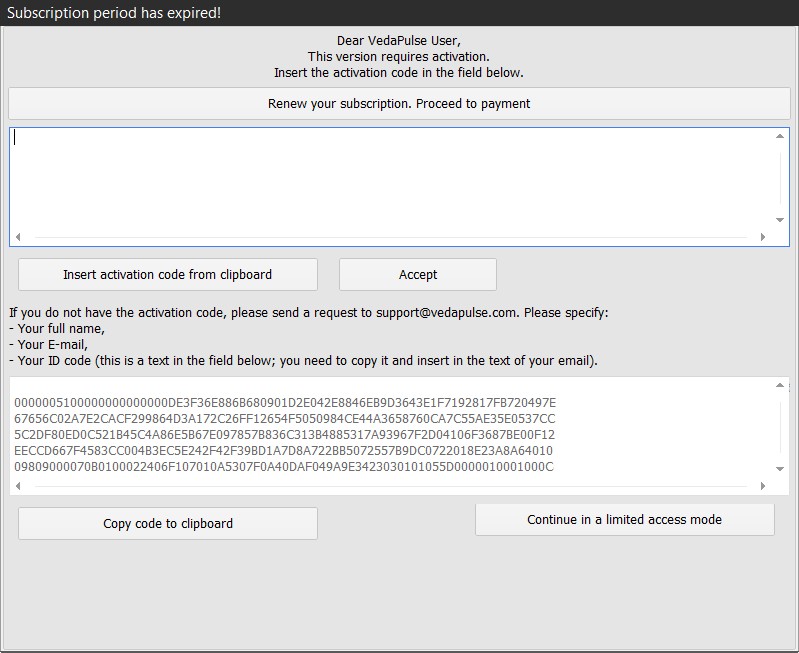
At running the program for the first time, you'd see the "Activation" window displayed on the screen. If you have already been sent the activation code by email, you should copy it and paste it in the upper empty field, click "Accept", then wait for the program to restart. If you didn't get the activation code yet, contact the technical support.
Running the program without an activation key will provide you with an access to the demo mode only.
To activate the program:
- Copy the code you got from the technical support.
- Insert the USB key (red flash drive) into the computer.
- Start the VedaPulse program
- You'd see the activation window displayed.
- Click "Insert activation code from clipboard".
- Click "Accept".
After the restart the program will be ready for work.
Introduction to the subscription system of “VedaPulse” software.
The extended functionality of VedaPulse program is available under a subscription only.
The first year of usage is included in the price of the basic version. The user gets an access to the extended functionality of the program, new modules, and a free upgrade during the year. In a year, the subscription would need a renewal.
You can check the date of getting/latest renewal of the subscription in the settings of the program (Settings – My subscriptions).
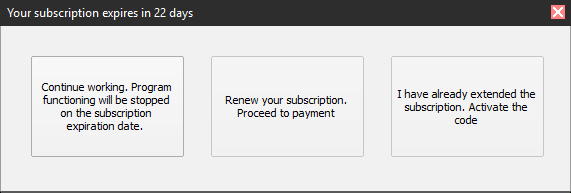
30 days before expiration date, you will receive the first notification on the renewal the subscription at launching the program. You'd get another notification 10 days before the expiration date.
5 days before the expiration date, you'd start getting notifications every day once a day at launching the program.
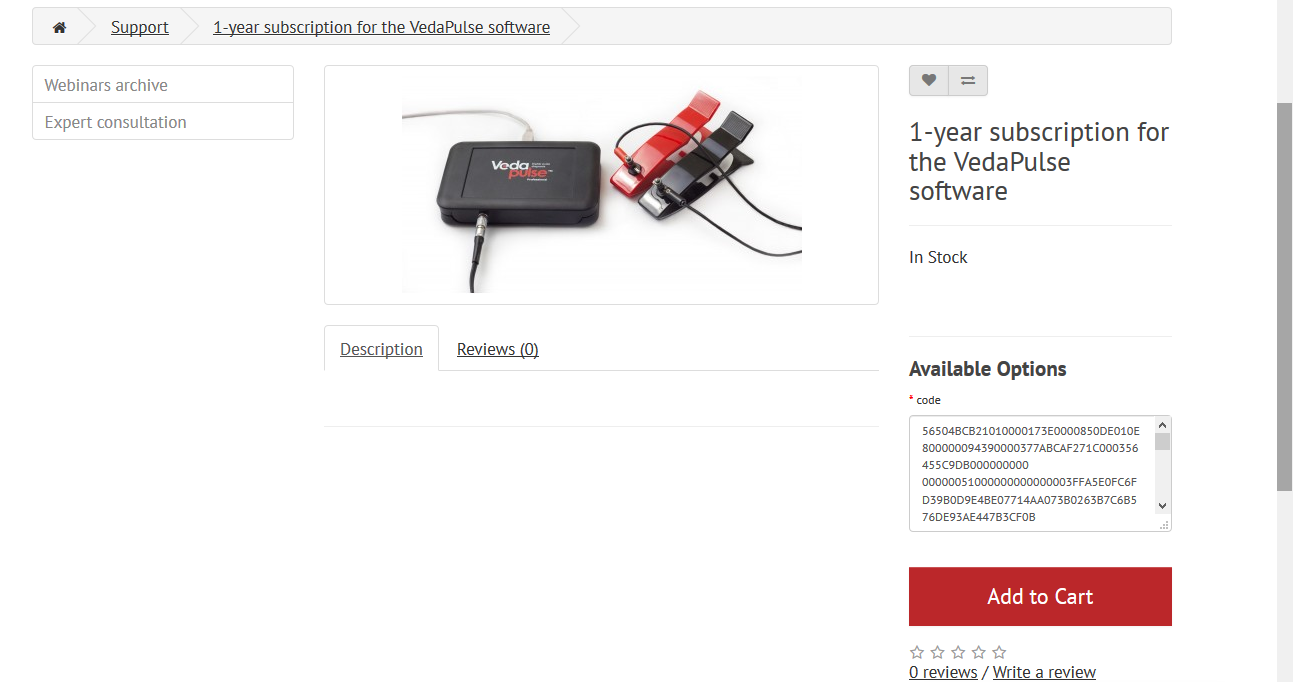
Click the "Renew subscription" button to switch to company's website, where you can complete the renewal.
To continue working with the program, click "Continue working".
Click "Activate code" to open the activation window. If you have already purchased a subscription before and received an activation code, you can activate it by inserting it in this window.
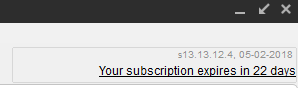
At launching the program, you'd also see the number of days remaining before the subscription expires. Click on the underlined text to switch to the payment page. as the work on the optimization of the program never stops and we keep improving the Software, introducing innovations based on the requests made by the specialists, who actually use the program. The subscription allows you to get an access to the latest version of the Software, which is renewed annually.
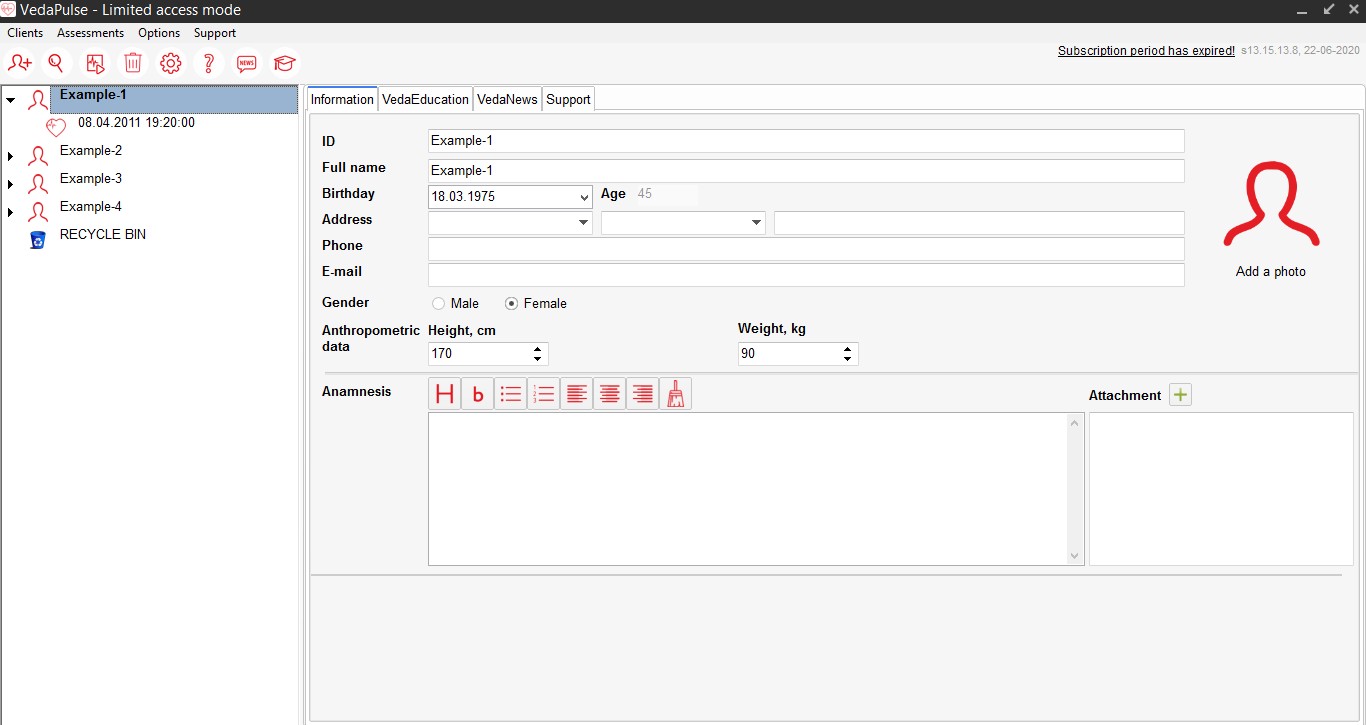
After the subscription expires, the program is not getting blocked, but keeps working in a limited mode: you would be able to make recordings, see the real time ECG displayed on the screen, and save the results. Every time the program is launched, a pop-up window would remind you to renew the subscription, so you could regain the access the full functionality (the Results and Recommendations tabs). The “Renew subscription” button switches you to company's website, where you can complete the renewal. Either you could close the reminder window and start the recording.
All the recordings performed under the limited mode are automatically saved. After getting the subscription renewed, you would get the full access to the results of the assessments.
Besides, the limited functionality mode provides an access to all the reports saved before expiration with the ability to edit, save and print the texts.
Before starting the assessment
Fill out the specialist profile. To do this, go to menu Options - Specialist profile:
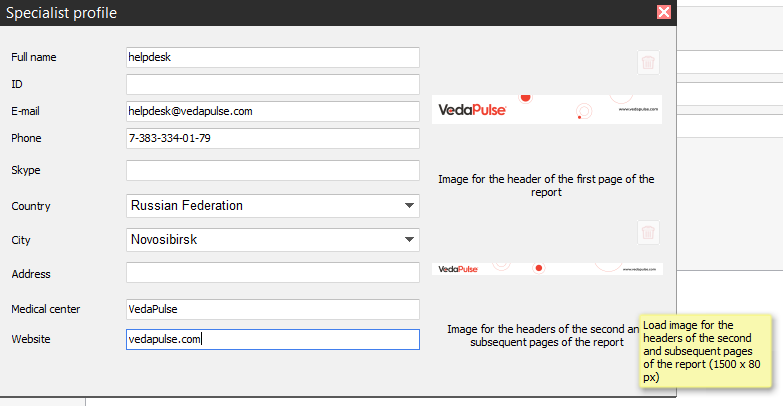
You can also customize the headers of the general conclusion by uploading your images. The first image will be placed on the first page of the conclusion, the second - on the subsequent ones.
Please consider the following technical requirements when uploading an image:
• Image file format: jpg, png, bmp
• First page header resolution - 1500 х 180 pixels. Image is aligned at the left.
• Subsequent pages header resolution - 1500 х 80 pixels. Image is aligned to the center.
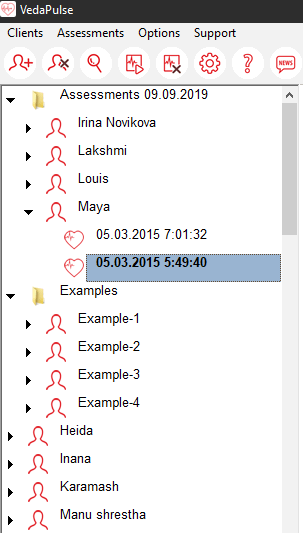
Multi-level client catalogue
Meet the new structure of client ID cards and assessment files.
Due to the new option of multilevel arrangement of client cards and the assessment files, it is now possible to group the cards by folders. For example, you can put all the cards created at one particular day, month, year or event into one folder.
It is also possible to open several cards at one time, which allows browsing the list of all the assessments of each client you choose.
Drag several cards or folders into a separate root folder, or mass delete the files.
To do this, select the desired files and drag them to the folder or the Recycle bin accordingly.
Ctrl + click selects single folder, client card or assessment file. To selects several files, hold Ctrl and click the
desired files.
Shift + click – multiple selection of folders/cards/assessments. Hold Shift, click the first and the last file in
the list.
Deleting the files - after selecting one or several files, press Delete button to send them to the Recycle bin.
Recycle bin
Recycle bin is now available at the end of ID card catalogue. All deleted files are located in the Recycle bin. If necessary, the contents of the Recycle bin can be permanently deleted or restored.
A cross-patient data comparison in the module "Dynamics"
Before, it was only possible to compare the assessments within one patient’s card. The updated software allows comparing the assessments across two and more patients.
Add a new patient. You can make it in several ways:
- Press a key combination «CTRL+ALT+P»
- Press a button in a main menu: New client
- Choose a command in a top menu: Clients/New client
- Choose in a context menu (press a right mouse button in catalog to open it): New client

The patient card will open - the Information tab. Fill it.
Field ID displays the patient card in the list on the left.
If Privacy Law is applicable in your country, do not use ID field to enter full patient name to ensure privacy!
Field Name allows you to fill in the information tab automatically Statistics and Report.Fields: Sex, Age, Height, Weight are used by the program to calculate the integral index Health level in the Results/Indices tab.
The remaining fields are optional.
You can add a patient’s photo by pressing “Add a photo” or, if it was added earlier, you can replace it by pressing an existing photo.
Also you can add attachments in a patient card by pressing “+”. Choose file and it’ll be copied in a patient card. Later you can open it by double clicking from the list.
Menu point “Data export” allows exporting all clients’ catalog. All information (height, weight, email etc.) will be saved in Excel table.
The patient’s card
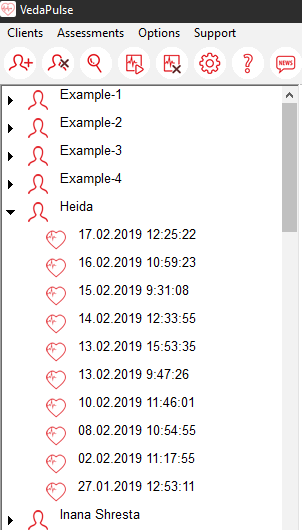
The groups of patients
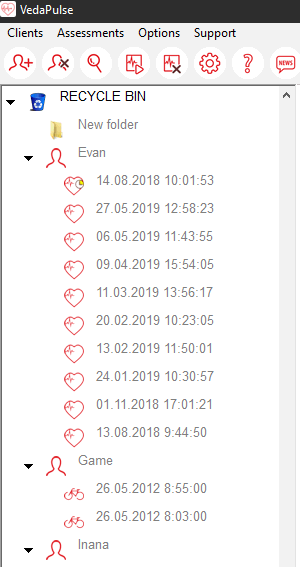
Recycle bin
Conducting assessment
Connect the electrodes to the wires of the signal cable. Look at the color of the plastic tips located at the ends of
the wires.
Note. Previously released devices were staffed with red and black wires.
Connect the wire with the red tip (or red wire) to the red electrode.
Connect the wire with black tip (or black wire) to the black electrode. Secure the cable with the screw.
Note. The devices of the first issue is partially staffed with yellow and green electrodes. In this case, the
color of the electrodes is not important.
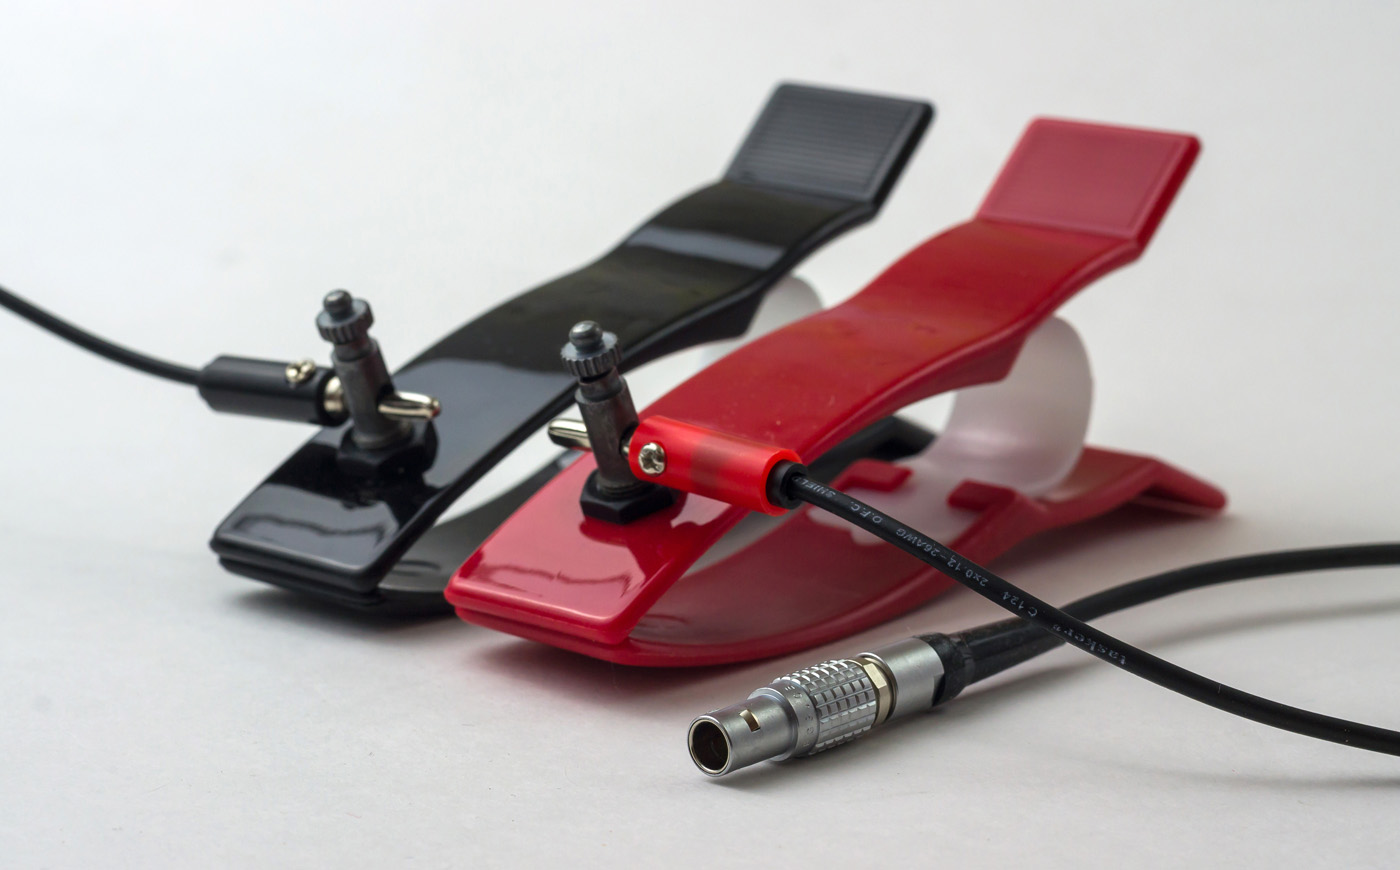
Connect the signal cable to the device.
Note. Devices of the first edition were packaged with a non-detachable signal cable, which has always been
connected to the appliance. Modern devices are equipped with replaceable signal cable with Lemo-connector, Swiss
made.
Connect the device to the USB port. Do not use any USB hub. Only direct connection to a USB port on the computer is Valid. We remind you that after downloading the program you can disable the USB key and use a vacant USB port for connecting the device.
Put the electrodes-pins on the wrists of the patient. Electrode of the red color for the right hand, and the black - for the left. Or focus on the color of the wire or plastic tip, depending on what set you have. In electrocardiography the electrode location, when they are placed on the wrists, is usually called the first lead. Hereinafter goes another scheme - the second lead - it is described when it should be used.
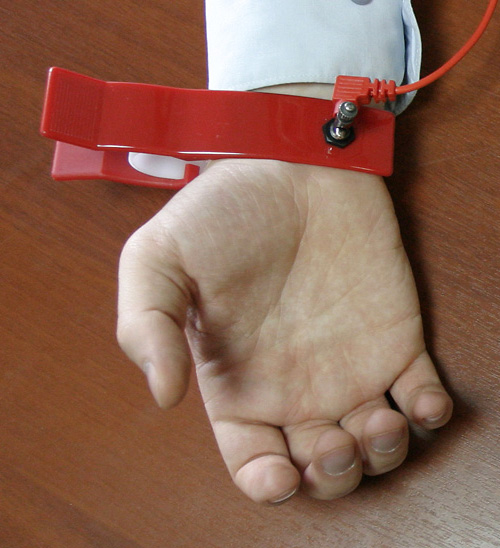
To improve the conductivity of the metal contact pads of the electrodes apply a special gel for ECG or simply moisten wrists with water in areas that will fit these contacts. Do not use distilled water - it is a poor conductor. It is better to take normal water from the tap.
The best position of the patient during the record is lying on the back on the couch. Also valid position is sitting in a comfortable chair. Make sure that nothing impede the quality of contact of the electrodes and the skin surface. For example, if the wrist is too close to the body, the contact can be broken by the slight hand movement. We recommend placing small pads under the forearm so that the electrode does not contact anything: couch, chair arms, body, etc.
Click Assessment/New assessment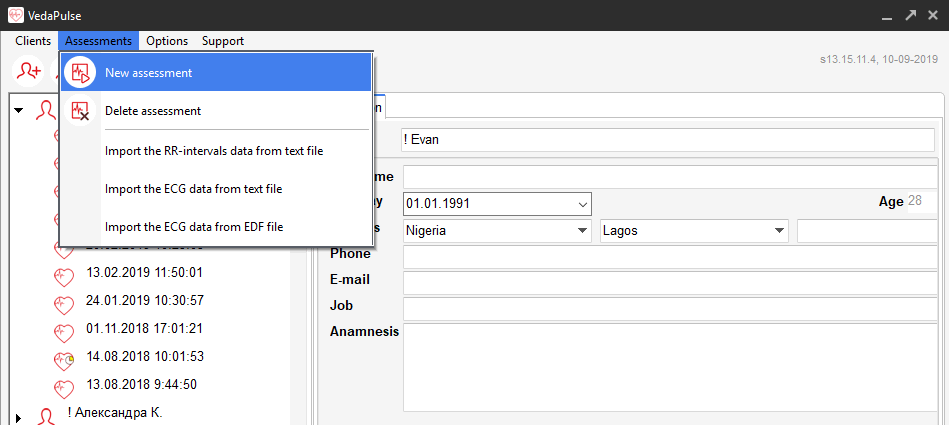
Monitoring
The window Monitoring parameters opens, it is designed to adjust time of recording. By default, the program offers 5 min. This time is optimal for the analysis of Hearth rate variability (HRV). Less time will not allow to calculate the LF-range with spectral analysis correctly, and more time could increase the risk of registration of transient effects on heart rhythm. It is recommended to accept this time, if there is no particular meaningful reasons to install a different time. But remember that it is correct to compare results only of the assessments of one duration.
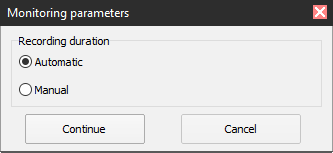
After pressing the button Continue the window of the ECG signal registration appears.
Some time keep watching of the ECG signal on the monitor screen. Ensure quality signal. When the signal is low, check the quality of the gel or moisture. By the way, if after working the gel is not removed, then he dries out and forms a crust, which subsequently degrades the electrical contact. It is therefore important to wash off the gel with a wet sponge and wipe the contacts of the electrodes dry after working.
If the signal contains a lot of noise, then disconnect the laptop from the network and use only battery of the laptop. In any case, do not proceed to the next step until you are sure in the quality of the signal.
If the signal is low and contains a strong noise, we use the second lead: the red electrode on the right wrist, and the black on the left ankle. In this case, you may again need to use gel or additional wetting for the contact points at the ankle.
Strong pollution of the signal with noise happens when working in areas with large numbers of working appliances, bad wiring in the room, proximity to power cables, power lines, or when working on a computer with low level of protection against power line disturbances. Also the dry air in a room, the use of synthetic or wool clothing, as the patient, and the specialist conducting the examination - all this creates an electrostatic field, which becomes a source of interference.
Usage of a second lead usually increases a signal thrice. And together with the using of the laptop on the battery allows you to conduct a qualitative assessment even with very high noise level.
Use of the second lead (the red electrode on the right wrist, and the black on the left ankle) and passing power on the laptop battery is recommended always when there is a doubt in the quality of the signal. This way you will avoid an appearance of artifacts on the record and the need of manual editing after recording.
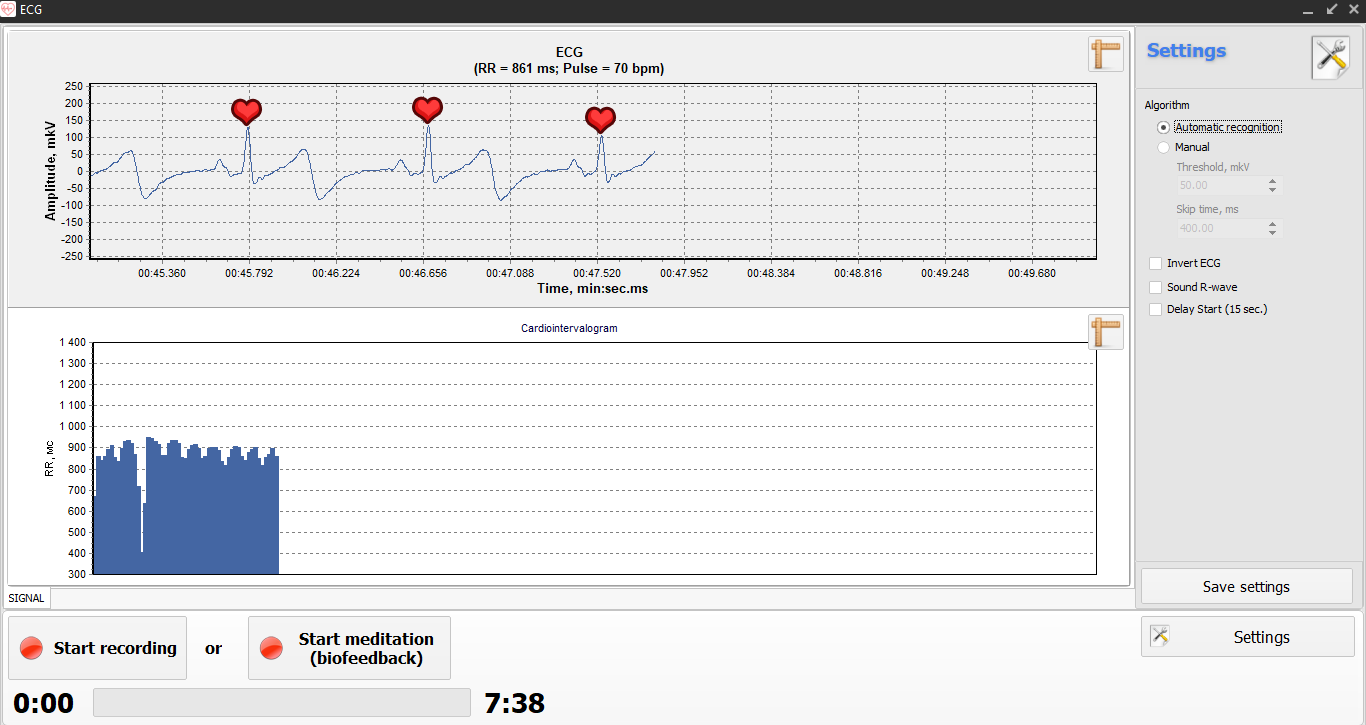
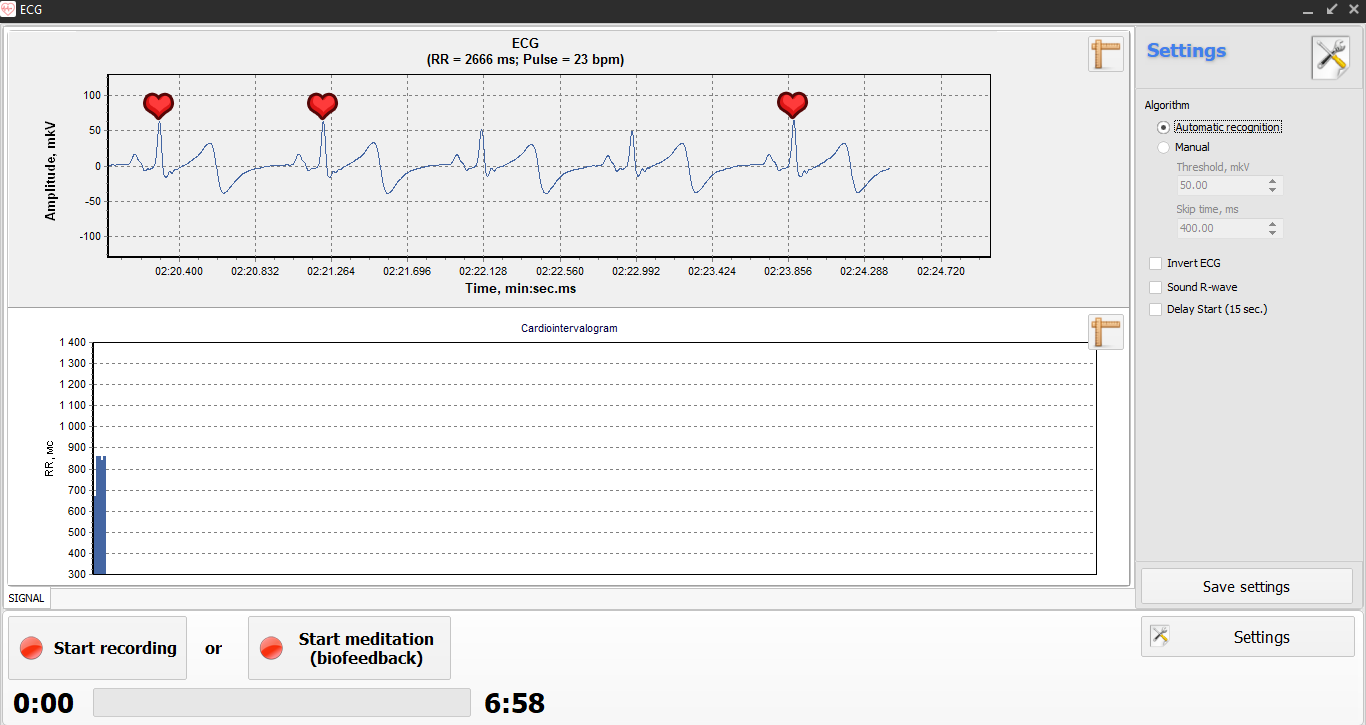
Please, note, the program automatically adjusts the scale. You can wait for optimal display scale, and uncheck the Automatically. This will lock the scale and simplify visual inspection of the signal. You can also manually adjust the scale, putting the maximum and the minimum. After adjusting the zoom level of the signal on the screen, go to setup of the allocation of R-waves. For this purpose, adjust the Threshold. This is the top-most window in the settings located on the right side of the screen. On the axis of ordinates define the R-wave amplitude in mkv and roughly divide it into two. The resulting figure should be filled in the Threshold. Watch the program recognizing R-wave. At each R-wave an icon-heart should appear.
The program has two modes of signal recognition: Automatic and Manual. By default, the Automatic mode is set. Typically, in just a few seconds after receiving the signal, the program automatically configures and starts to recognize R-waves. Each peak will be marked with a heart-shaped icon. Keep an eye on this process for a few seconds. Make sure R-waves are detected correctly. There should be no omitted R-waves. Heart-shaped icons should not appear on other waves – P and T.
If no errors are seen within 10-15 seconds of recognition of R-waves, you can start to record the signal. In case it is not possible to receive good quality of R-waves detection, switch to the Manual mode. The switch between the modes is in the upper right corner of the window.
After switching to the Manual mode, adjust the Threshold value. For this purpose, configure the Threshold value. This is the top-most window in the Settings located on the right side of the screen. On the axis of ordinates, define the R-wave amplitude in μv and roughly divide it in two. Insert this number in the Threshold window and press Enter. Watch how the program detects R-waves - each R-wave should be marked with a heart-shaped icon.
To start the record, you need to click the “Start monitoring” button. By doing so, you will initialize the timer under the “Start monitoring” button.
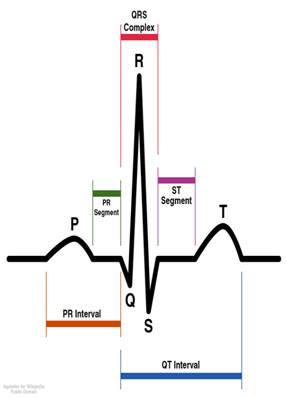
Carefully review the scheme and learn how to identify R-wave on ECG signal visually.
When the gaps - if the icon-heart skips a separate R-wave - reduce the value of the threshold.
If the icon-heart appears on other waves, except R-wave, one should increase the value of the threshold voltage.
The R-wave amplitude depends on the individual electrophysiological parameters of the patient. If the threshold value has to be reduced below 25 mkv to achieve the allocation of R-waves, it's a compelling argument to the second lead, as this indicates a low signal level and increases the risk of artifacts. But, of course, the main reason for the decision about the need to move on to the second lead is the fact that it is not possible to achieve a stable allocation of R-waves by setting the threshold voltage. If, despite all efforts artefacts appear, then proceed to the second lead. It often happens that it is easier to increase the useful signal than to fight the noises that lead to the appearance of artifacts. Important: it is not necessary to eliminate the noise completely, it's only important that this noise is not scored useful signal and does not interfere with the stable allocation of R-waves.
Take your time. Adjust quietly, so as not to affect the emotional state of the patient. Before starting recording, the participant has to give a few minutes to sit quietly to calm down the heartbeat. But if the specialist hastes and is nervous in preparation for the beginning of the assessment, then his mood can be transmitted to the patient. It is important for the specialist to act confidently and calmly to minimize the impact on the patient. But don't fall in to another extreme - no need to enable slow meditative music to immerse the patient in relaxation artificially. The music has a great influence on people and can considerably change the normal functional state. If the task is to estimate the normal functional state, then eliminate all the factors that can change it. The best time for assessment is the first half of the day, it is undesirable for the patient to experience a severe famine. It is also important that the patient the day before the survey did not take alcoholic drinks, did not feel any strong emotional and physical exhaustion in the previous days. But if the patient has violated any of these terms of preparation for the assessment, but did come, it makes sense to conduct a survey and repeat it in future to be able to compare the results of the assessment in the normal state and under the influence of the corresponding stress factor. This will give additional information to assess the impact of the lifestyle that leads the patient, its functional state.
After achieving quality settings of R-wave, you can save the settings by clicking on the button Save settings. Thereby you will simplify configuration when the survey is conducted in this patient next time. After saving settings, you can go to the assessment's record.
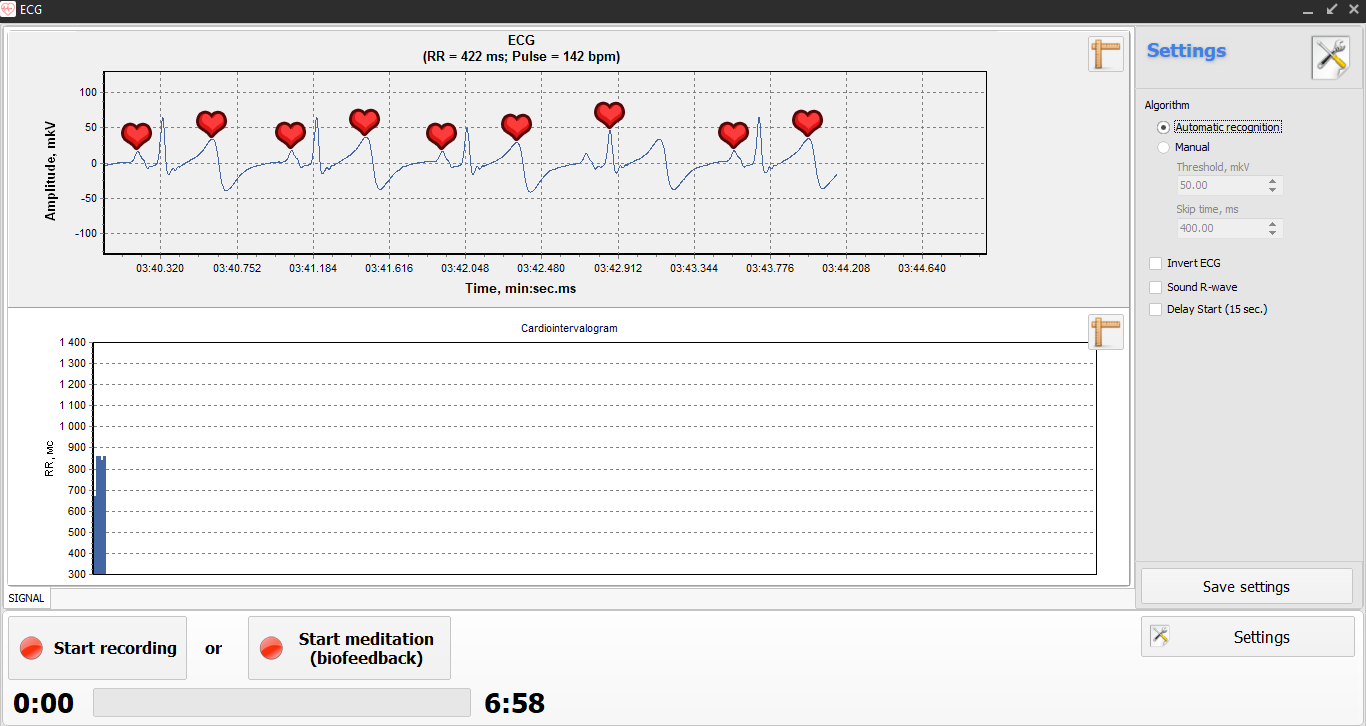
To start recording you need to click on the Start recording. Then at the bottom of the screen will turn on a timer that displays the recording duration. Simultaneously with the timer a graph of Cardiointervalogram will start and display, it shows in real-time mode changing of the cardiac cycle's duration.
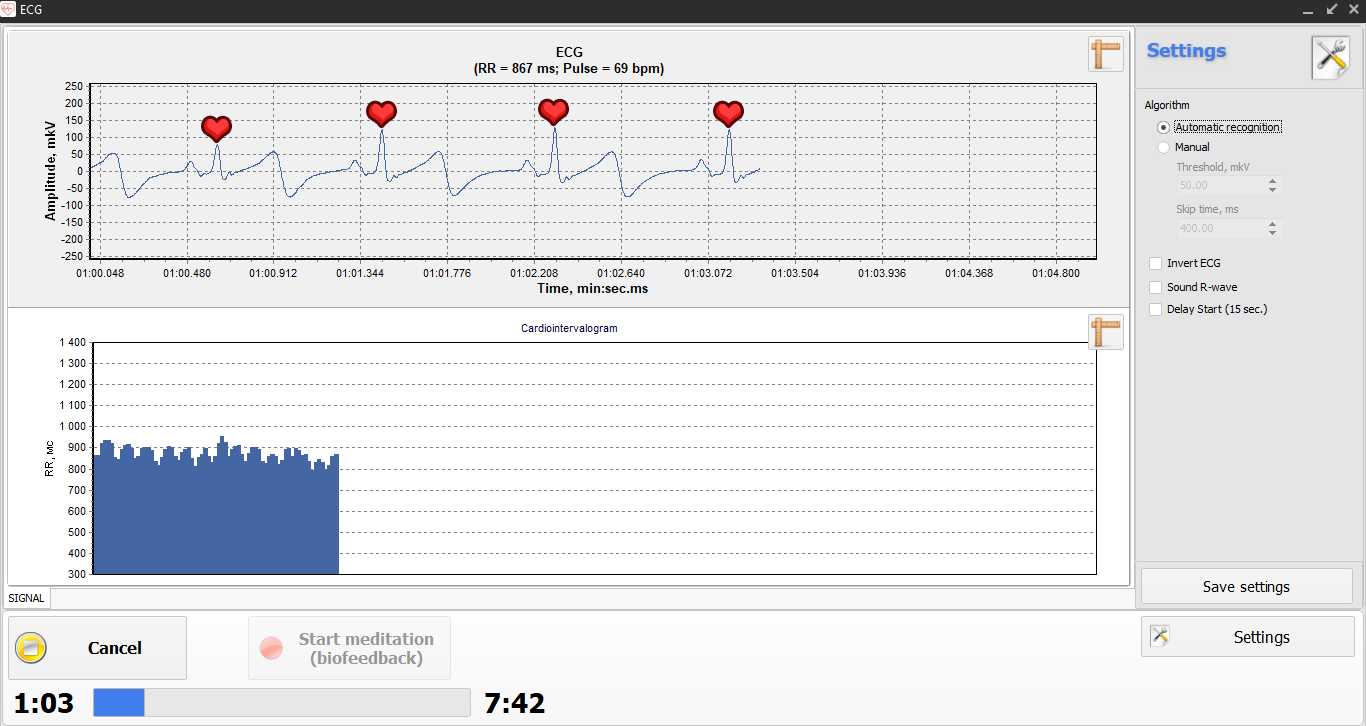
Observing this graph, a specialist in the process of recording can assess the stationarity of the recording, that is, to assess how stable the functional status of the patient is. The monitoring of the recording allows to stop the assessment to eliminate the cause of changes in the functional state of the patient. Also, on the graph one can dynamically track the result of any impact on the patient. Use this in the case when the purpose of the assessment is not an estimation of the functional condition of the patient, but the evaluation of the degree of influencing factor. But remember that if you operate on the patient during the recording and change its functional state, these entries will be suitable mainly for visual assessment of the dynamics of cardiointervalogram, but not for automatic HRV-analysis by the program. Because the algorithms of HRV-analysis work only on stationary records, when the patient does not change the functional state during the test.
During the recording the patient should not talk, sneeze, cough, take deep breaths, experiment with the rhythm of breathing or eating, chewing gum, swallowing saliva, making any mental effort - that is, you must not perform any actions that may affect the heart rhythm. In case of violation of these rules, stop recording, delete it and re-assess this patient.
In the case when the aim of the assessment is to examine the effect of any factor, these rules can be changed according to the task.
Note. To delete an entry, use the command Assessment/Delete assessment.
Meditation (biofeedback)
“Meditation (Biofeedback)” includes 4 expert extensions:

Expert extension "Flower of the heart"
It helps to reduce stress level and prevent heart diseases and can also be used to promote correct breathing
in pregnant women.
Expert extension “Cycle race track”
For people who are interested in sport and fitness.
Expert extension “The Force Awakens”
For Naturopaths. It is designed to awaken the inner reserves of the body.
Expert extension “Harmony of Chaos”
For people involved in bioenergy and breathing practices.
Open the signal registration window to run the expert extension "Meditation (Biofeedback)". Adjust the ECG signal and click the button "Start meditation (biofeedback) session" to choose one of the 4 possible game scenarios.
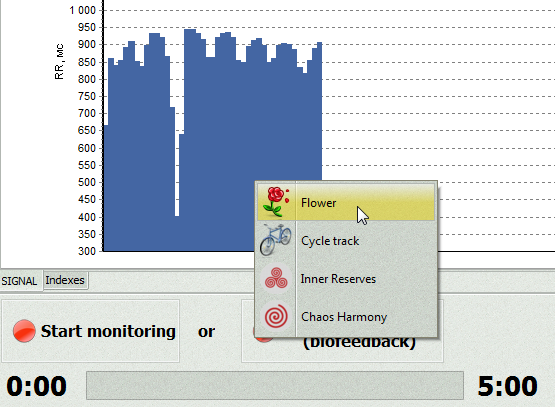
Expert extension "Flower of the heart"
Choose the scenario "Flower of the heart" and it will run automatically in 15 seconds. Sit quietly during these 15 seconds, don’t meditate. The program will estimate the initial stress level of the heart. Training starts after an auto switching to the mode "Dissolve a flower". Use the heart stress graph or the multimedia scenario "Flower of the heart" to do meditation and biofeedback.

Heart stress graph. We recommend to start with this simple mode. Imagine that this is a glass of water. When the heart relaxes — the glass fills with water, when there is tension — the water level decreases.

Multimedia scenario "Flower of the heart". " If the heart relaxes, the flower starts blooming. The stronger is the relaxation, the more flowers are there. The number of opened flowers is a measure of the training effectiveness.
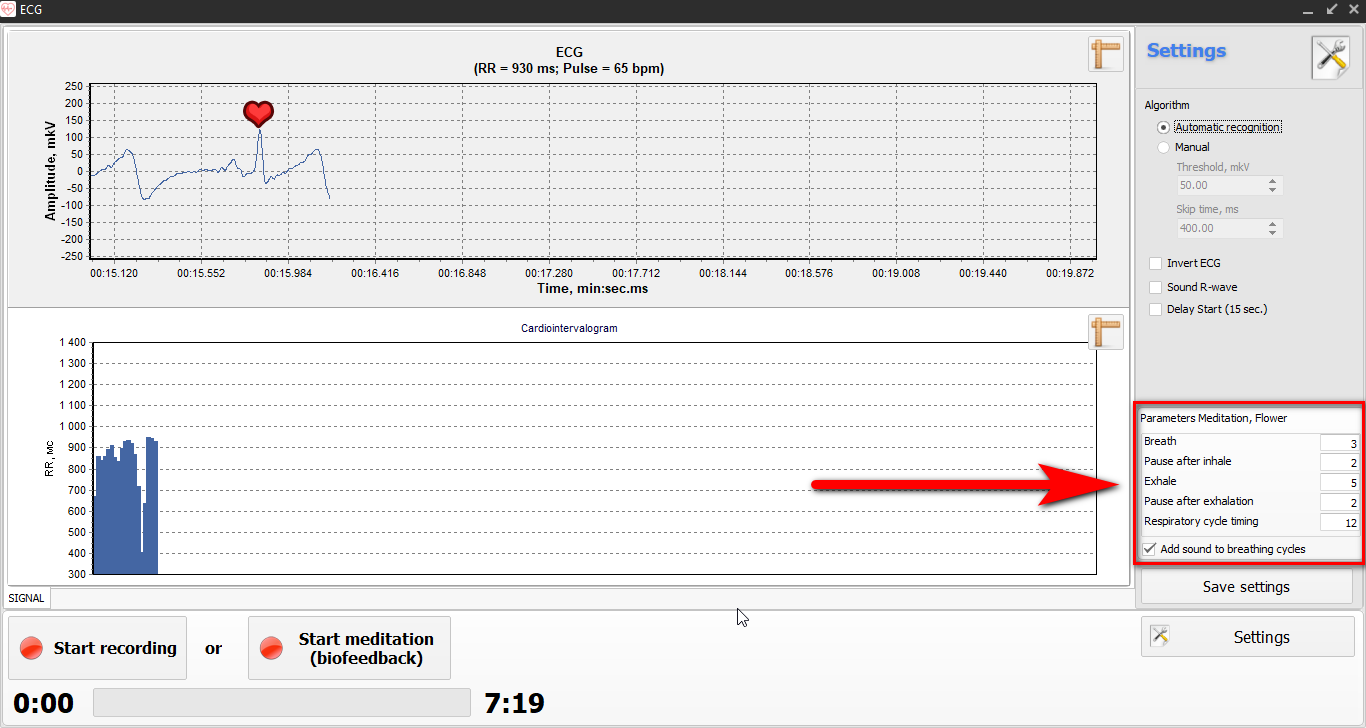
After adjusting the ECG signal, click on Start meditation (biofeedback), the timer will start in the same way as in the monitoring mode, but after 15 seconds you will be redirected to the Flower tab automatically. It is important for a participant to stay in a normal, relaxed state during these 15 seconds, because this is the period for recording of a basic state (the training will be based on this data). If you hasten and do not take time for preparation, the state of tension, which the participant felt during preparation stage, will be registered. Before clicking the Start the meditation (biofeedback) button, it is important to ensure that the average heart rate (HR) is relatively stable. Heart rate can be monitored at the top of the screen, as well as on the cardiointervalogram graph at the bottom of the screen.
The Flower tab is the basic mode of meditation (biofeedback). There is a video of a rose flower in the left part of the screen. Right part of the screen shows a graph with changes in the heart rhythm. Bright blue horizontal line in the center of the graph indicates the average heart rate (HR), calculated by the program during the first 15 seconds of the recording. This graph is somewhat similar to a glass of water. During the meditation session (biofeedback), the level of "water" is constantly changing, reflecting the change in the duration of cardiac contractions. With increased duration of the cardiac cycle, the level goes up, and with reduced duration - it drops down. Lower level indicates mobilization (tension), and the increased level indicates relaxation. With the relaxation the flower starts to blossom.
The more flowers participant will be able to dissolve, the better your result will be. There is a counter of opened flowers at the top of the screen. During the training, one may look at the flower or at the fluctuations of the "water" level, all up to the person’s preference.
The goal of biofeedback is learning the art of relaxation, that stimulates self-regulation and self-healing processes in the body. In Vedapulse this is done by learning the "proper" breathing. In order to relax, to relieve stress, you need to use abdominal (diaphragmatic) breathing. The program helps to learn how to feel your breathing, the beginning of inhalation, the end of inhalation, the beginning of exhalation and the end of exhalation, the slight pauses between inhalation and exhalation. Breath is like the ocean, the inhale and exhale as the waves of the high and the low tide.
Tune the body for the breathing exercises, like a musician tunes the instrument before the concert. Remember a very simple rule, very easy way: learn slowly, gradually draw the stomach in the end of the exhale, try to extend this phase. With proper exercise one will experience relaxation, while the level of "water in the glass" will grow, the main line of its vibration will be above the "waterline". Also the flowers will bloom. While excessive haste or excessive lengthening of the expiratory phase there will be a reduction "of the level of water in the glass" and roses cease to bloom. For working with the breathing module the indicator of the breathing cycle is included:
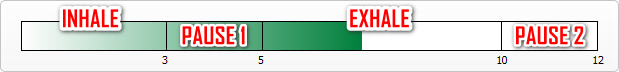
During the session the scale of the indicator gets filled, one filling corresponds to one respiratory cycle. The respiratory cycle is divided into 4 phases:
- Inhale
- Pause after inhale (Pause 1)
- Exhale
- Pause after the exhale (Pause 2)
This is followed with the sounds of the metronome and the bell indicates the completion of each phase of the respiratory cycle. The Indicator is to be used for breath control, executing the steps corresponding to a current cycle of action:
- The indicator begins to fill in with the phase "Inhale" – one should breathe in.
- The phase "Inhale" is ended -the "Pause after inhalation" phase starts– hold the breath throughout the phase.
- The "Pause after inhalation" phase is ended – the "Exhale" phase starts– breathe out evenly throughout the phase.
- The phase "Exhale" is ended – the phase "Pause after exhalation" starts– hold the breath to complete the respiratory cycle.
After setting the required values you can start the meditation. In order to retrain thoracic breathing into diaphragmatic one the most important thing is to learn how to pull the stomach in in the end of exhalation. Do not think about breathing in, pay no attention to it. Your "work area" — is an exhalation. After the air fills the lungs during exhalation pull your stomach in as if squeezing the air. After the air has left the lungs and you want to take a breath — the stomach would slightly go forward by itself, thus you’d get a diaphragmatic breath. During the exhalation - again pull the stomach in and stop pulling it in in the beginning of inhalation, that would be the “inhalation into your stomach." This will allow you to easily learn a proper, diaphragmatic, slow breathing and get relaxation as a result. Beside a visual observation of the oscillations of the heart rhythm, there is an additional option of insonifying the heartbeat. In order to carry it out, enable the corresponding option (sound R-wave) in the settings of the window of the signal registration check. After enabling this option we add the acoustic feedback channel to the visual one. Hearing the beats of your heart is a powerful way to impact the heart rhythm. The returned biological signal can even enter the trance state. In addition to learning diaphragmatic breathing and meditation-immersion into a trance state using audible signals, biofeedback mode can be used to study any form of anger management.. Description of anger management techniques is beyond the scope of this guide. We focus our attention only on the fact that using visual and acoustic channels of bio-feedback provided by "Vedapulse" any user can successfully study different techniques on a self-learning basis: meditation, auto-trainings, breathing exercises, etc. And in case of the usage of "Vedapulse" by a coach there appear additional tools for an objective control of dynamics of the physiological state of the patient. In the end of the session a new assessment with the icon of a flower will appear in the list of assessments:
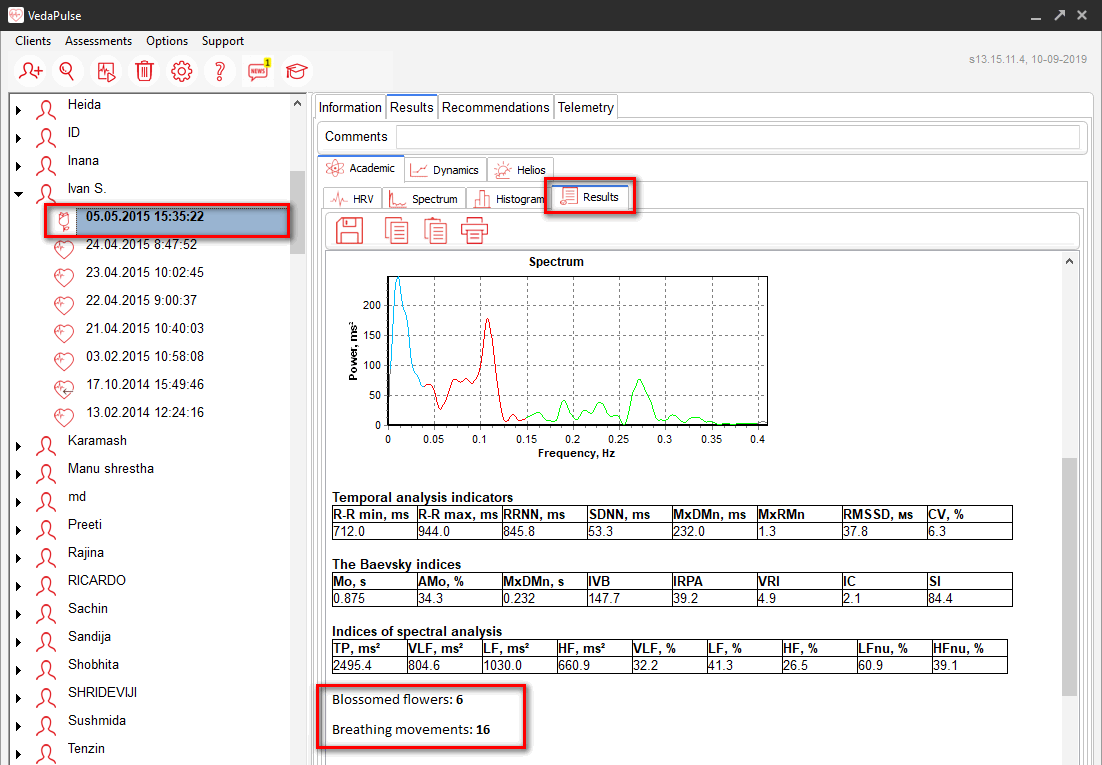
If you select the assessment and open the tab " Results of the assessment –Academic – Statistics" - at the bottom of the report, you will see the number of breathing cycles and flowers grown during the session.
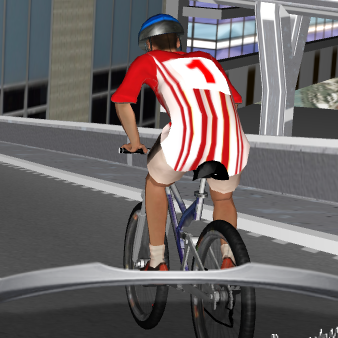
Expert extension “Cycle race track”
Game scenario “Cycle race track”. Degree of relaxation defines the speed of a cyclist. User’s task is to overcome the racing excitement and relax.
Racer in the red T-shirt is a participant, and racer in yellow – his opponent. The video shows that when the heart rate (HR) is higher than 60, the opponent in the yellow T-shirt leads, and when heart rate decreases, the person in the red T-shirt overtakes. Changes in the user’s heart rate are shown at the bottom of the screen. That is the biofeedback program’s basic idea: relax and decrease heart rate to win (a decrease in heart rate is one of the most important indicators for lowering the heart tension). As a rival — user’s previous result. So, compete with yourself, improve the result and achieve greater relaxation every time.
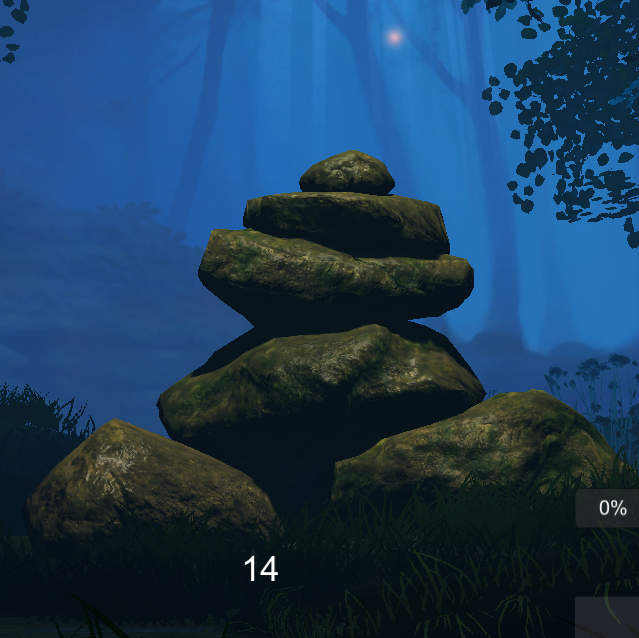
Expert extension “The Force Awakens”
Expert extension “The Force Awakens” offers to move seven stones using “power of the mind”. This scenario reinforces the will to life and health. The fact is that modern medicine gives the patient a passive role. It requires only following the physician’s recommendations. Passive role destroys all initiative of the patient. At the same time, internal motivation to recover is a powerful force that can help in hopeless situations. Scenario “The Force Awakens” is designated to awaken the hidden reserves of the body.

Stress causes many diseases. This scenario demands to lift the stones with the power of mind, and at first user can feel even greater tense, but it won’t move the stones. The program monitors the heart rhythm and the stones will lift if there is no internal stress. Moreover, don’t try to fall into trance. The goal is to maintain a calm attention, to contemplate lifting stones, and be internally peaceful.
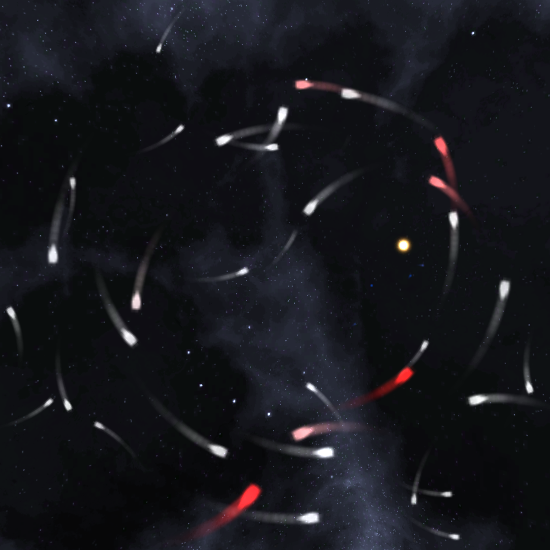
Expert extension “Harmony of Chaos”
Software extension "Harmony of Chaos" is related to the dual pair of life and death. Life is the maintenance of internal order in the body, and chaos is the path to illness and ultimately to death. This scenario was designed to perform a meditation and "organize" the body’s proper functioning. It is necessary to harmonize the seven chakras during meditation. First observe the Muladhara chakra and imagine a harmonization of the chakras. If meditation is successful, random motioning comets will organize their flight, gather in a circle and light the supernova on the computer screen. The color of the star matches the color of the chakra. You need to light up the seven stars to adjust the seven chakras.
Expert extensions “Cycle race track”, “Harmony of Chaos” and “The Force Awakens” are paid options of
"Meditation/Biofeedback".
Cardio biofeedback is an effective way to reduce the stress of the heart. It was recommended by the all-Russian
scientific society of cardiologists.
"Skills of autogenic training, breathing and relaxation techniques are important methods of psycho prophylaxis in the treatment of cardiovascular pathologies. Relaxation techniques teach patients the basics of psycho physiological self-regulation. It allows to reach the state of neuromuscular relaxation, accompanied by a decrease in heart rate and BP by 5-10 Torr, decreased respiratory rate. The most frequently used relaxation techniques are:
- progressive muscular relaxation technique;
- autogenic training;
- breathing relaxation training;
- biological feedback technique.
Besides learning the diaphragmatic breathing and ability to enter the state of trance by using the sound signal, Biofeedback mode can be used to learn any form of auto-training. Description of auto-training techniques is beyond the scope of this guide. Focus your attention only on the fact that using visual and acoustic channels of biofeedback provided by the VedaPulse software, the user can successfully combine a variety of techniques: meditation, auto-training, breathing exercises, etc. If used by coaches, VedaPulse software also offers tools for the objective monitoring the dynamics of the physiological state of a patient.
Importing and exporting the data
The VedaPulse Professional software has several options to import assessments recorded on the equipment of other manufacturers. All of them are accessible from the menu, which is in the upper left part of the program. When clicking on the Assessments, there will be three options for importing files in the drop-down list.
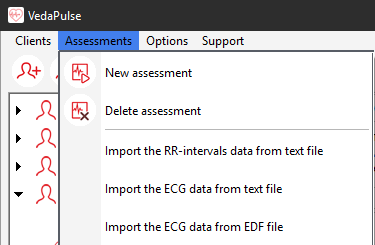
The option Import the RR-intervals data from text file allows you to import the assessment from various sports programs and devices equipped with chest sensors.
The option Import the ECG data from text file allows you to import the assessment from programs and devices capable of exporting an ECG record to a text file.
The option Import the ECG data from EDF file allows you to import an ECG record from the European Data Format (16-bit format intended for the exchange and storage of multi-channel biological and physical signals).
The VedaPulse Professional software also supports the export of assessments to text formats. To export the R-R intervals to a text file, go to Results > Academic > HRV and click on the Export Data icon, which is located in the upper-right corner of the ECG and Cardiointervalogram graphs.
Assessment results
The Assessment results includes several tabs: HRV (heart rate variability), Spectrum, Histogram, Indices, Balance, Meridians, Atlas, Nidana, Bioenergy, Music of the heart, Statistics.
HRV (heart rate variability)
The tab HRV contains the following graphics: ECG, Cardiointervalogram and Scattergram.
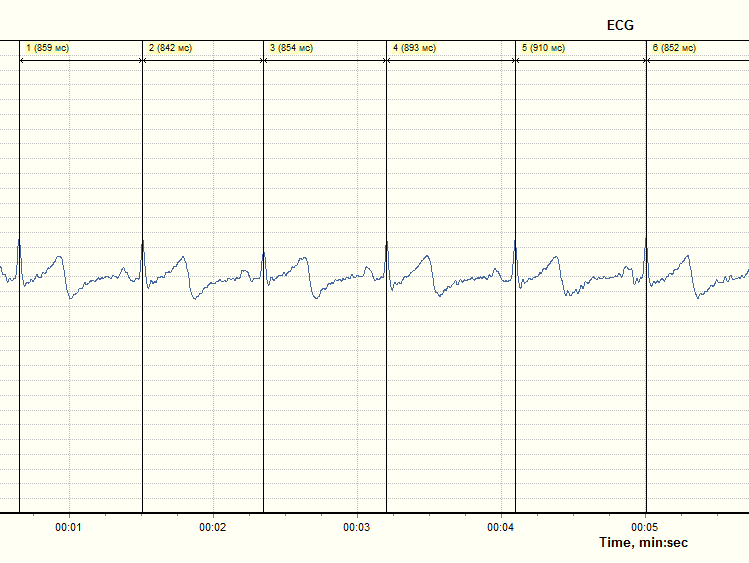
ECG
The graph ECG contains the initial electrocardiographic signal of the heart, here the program automatically puts the markers on the peaks of the R-waves. Those places on the ECG that during the recording are indicated by the icon-hearts, after the recording are highlighted with markers - black vertical lines. Right on top of each marker are number and duration of RR-interval in milliseconds (MS).
Cardiointervalogram
Cardiointervalogram it is a chart showing the successive changes in the duration of R-R intervals, i.e. it is a graph showing a sequential process of changing heart rhythm measured in milliseconds (MS) - tachogram of the heart. When the heart rate is declining (slowing of heart rate), then the graph is growing up, and increased heart rate leads to the decrease of the curve.
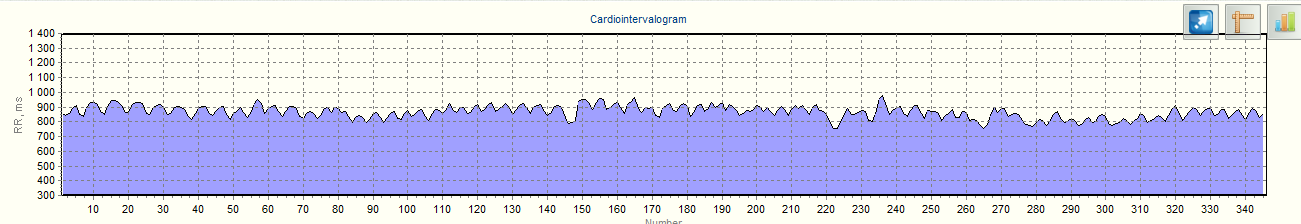
This chart clearly shows both - places of arrhythmias and artifacts - zones where the program was unable to find R-waves automatically due to the presence of high noise level, or a temporary loss of contact caused by the patient's movements.
The program automatically finds zones of arrhythmias and artifacts, highlights them in yellow. To do this, it compares the duration of adjacent RR-intervals and if the length differs by more than 20%, then highlights them in yellow.
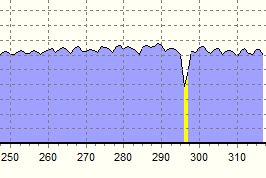
In "VedaPulse Professional" we use manual editing of artifacts. With proper training to conduct the assessment, the number of artifacts is minimal and there is no a great difficulty editing it if you acquire some experience.
Click with the left mouse button on the found artifact on cardiointervalogram, it brings you to a segment on the ECG record in the appropriate places for a quick way to edit markers.
A search of the zone requiring editing is easy to make on cardiointervalogram, and editing of markers is made on ECG.
In order to change the position of the marker hover over the item, press the left mouse button and move the cursor.
Then release the left mouse button.
In order to remove the marker, hover over the cursor, press the right mouse button, click "Remove marker". To insert
a new marker, click "Insert new marker"
In order to eliminate the interval from processing (for example, with arrhythmia), hover over the item, press the
right mouse button, select "Exclude".
Scatterogram
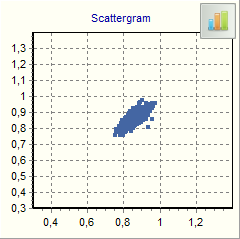
Scatterogram is a correlation rhythmogram consisting of points forming the cloud, where each point corresponds to one cardiointerval. The distance from the center of the "cloud" and the origin of coordinates corresponds to the mode (most frequently occurring of the duration of RR-interval in the record). The deviation of points from the bisector to the left shows how the cardiac interval is shorter than the previous one, to the right of the bisecting line - as it is longer than the previous one. Thus, consistently estimating the duration of adjacent RR-intervals we form the "cloud".
To understand the physiological meaning of this graph is necessary to proceed from dual
models of cardiac rhythm regulation proposed by R. M. Baevsky. This model is based on a cybernetic approach, in
which the system of regulation of the sinus node may be represented in the form of two interconnected levels
(contours): Central and Autonomous with direct connect and feedback. Working independent circuit structures of
regulation are: sinus node, vagus nerves and their nuclei in an oblong brain (circuit parasympathetic
regulation). The respiratory system is considered as an element of feedback in the Autonomous regulation of
heart rhythm.
The activities of the Central contour of regulation is identified with sympathoadrenal effects on heart rhythm,
is associated with respiratory sinus arrhythmia and is characterized by a different low frequency components of
heart rate. A direct link between the Central and Autonomous nervous circuits is performed through (mostly
sympathetic) and humoral communication. Feedback is provided by afferent impulses from the baroreceptors of the
heart and blood vessels, chemoreceptor and extensive receptor zones of various organs and tissues.
The Central contour of regulation of heart rhythm is a complex multilevel system of neurohumoral regulation of
physiological functions, which includes numerous links from subcortical centers of the medulla oblongata to the
hypothalamic-pituitary level of autonomic regulation and cerebral cortex. The structure of the Central loop can
schematically be presented as consisting of three levels. These levels correspond not so much anatomical and
morphological structure of the brain as certain functional systems or levels of regulation:
The 1st level provides the organization of interaction of the organism with the external environment (adaptation
of the organism to external influences). This includes the Central nervous system, including cortical mechanisms
of regulation, coordinating the functional operation of all systems of the organism under the influence of
environmental factors.
The 2nd level organizes the equilibrium of various systems of the body between itself and provides inter-system
homeostasis. The main role at this level play higher autonomic centers (including the hypothalamic-pituitary
system), providing hormonal and autonomic homeostasis.
The 3rd level provides in-system homeostasis in various body systems, in particular in the cardiorespiratory
system (the circulatory system and the respiratory system can be considered as a single functional system). Here
the leading role is played by subcortical nerve centers, in particular vasomotor center as part of a subcortical
cardiovascular center providing a stimulating or depressing effect on the heart through the fibers of the
sympathetic nerves.
In the analysis of scatterogram we estimate the length and width of the core (without extrasystoles and artifacts) of "clouds". The length of the "cloud" reflects the influence of Central regulation, and width - of Autonomous one.
The normal form of scatterogram is an ellipse elongated along the bisecting line (see Example No. 4 in the demo program). This location of the ellipse means that the respiratory added some values non-respiratory arrhythmia.
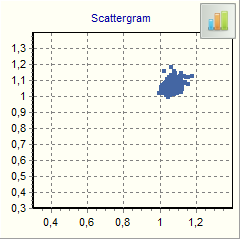
Scatterogram in the form of a circle means the absence of respiratory components of arrhythmia (see Example No. 5 in the demo program).
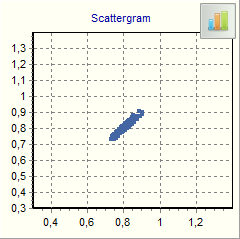
Narrow, long oval corresponds to the prevalence of respiratory components in the overall rate variability, which indicates a strong mobilization.
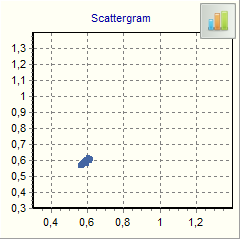
The cloud huddled into a small circle (see Example No. 3 in the demo program.) shows the reduction of rate variability, which corresponds to strong exhaustion.
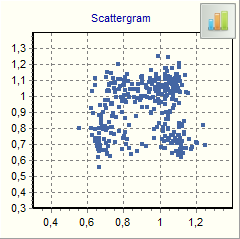
At points spaced away from the main group, it is possible to judge about the presence of arrhythmias. The study of scatterogram is particularly informative in cases when the background of normal cardiac rhythm encountered a sudden disruption and "loss" of individual heart rate. Graph Scatterogram allows to control the presence of artifacts and ectopic foci of rhythm.
Spectrum
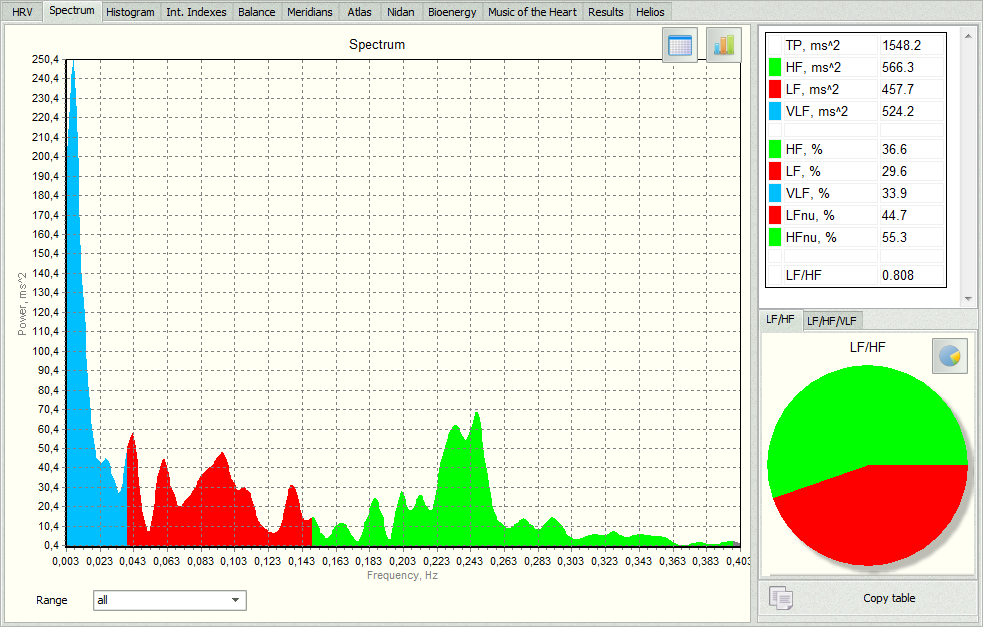
The tab Spectrum reflects the influence of different systems of regulation, modulating the amplitude-frequency
characteristics of heart rate. It allows you to evaluate the various frequency components of fluctuations in heart
rhythm. There are three main spectral components: HF, LF, VLF.
HF - respiratory waves, or fast wave (T=2,5-6,6 s, v=0.4-0.15 Hz) reflect the processes of breathing and other types
of parasympathetic activity on the spectrogram shown in green color.
LF - medium waves (T=6,6-25 C, v=is 0.15-0.04 Hz) are associated with sympathetic activity (primarily vasomotor
center), on the spectrogram marked in red.
VLF - slow waves (T=25-300 C, v=0,04-0,0033 Hz), various slow humoral-metabolic effects on the spectrogram are shown
in blue.
TP - total power of all components of the spectrum, reflects the body's ability to adapt under stressful load. In a
healthy person it is usually in the range of 2000-3000 units.
The graph Spectral power of ranges displays the relative magnitude of the ranges of HF/LF/VLF. It
assesses the equity of all components forming the heart rhythm. It is convenient to estimate the share of the
Central influences on the heart rate - VLF. And schedule "HF/LF" - shows the ratio of the influence of the
sympathetic and parasympathetic divisions of the autonomic nervous system on the heart. It is possible to assess the
autonomic balance - the ratio of the processes of mobilization and recovery of energy.
Histogram
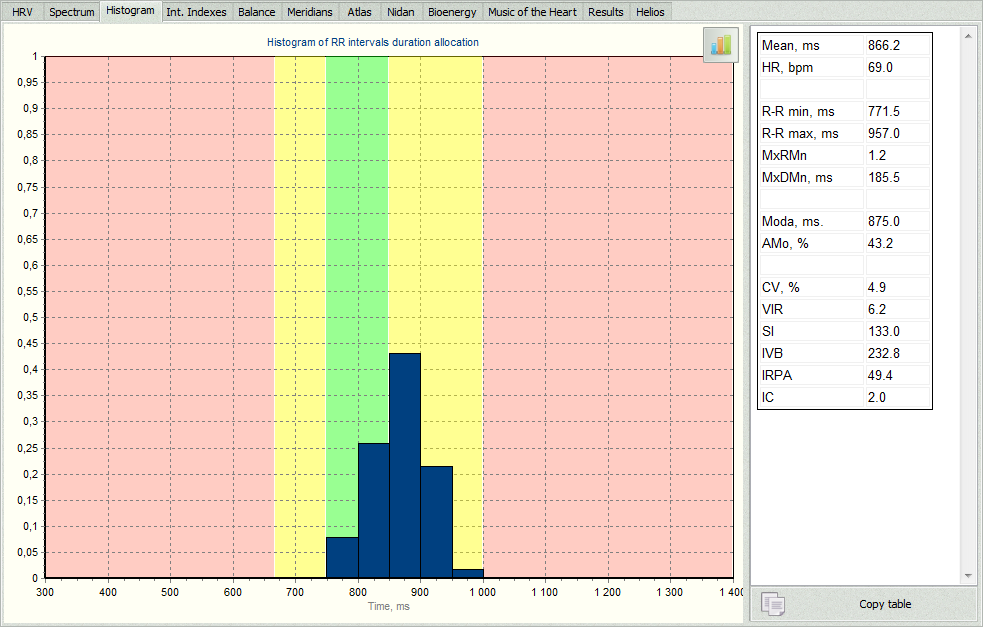
The histogram displays the frequency of distribution of RR-intervals. The histogram estimate the height and width of
the base.
1. The height of the histogram indicates the most common duration of RR-interval. It corresponds the amplitude of
the mode (AMO). The physiological meaning of this indicator is the price of adaptation, i.e. how many resources the
body mobilizes to maintain homeostasis. In a healthy person AMO is in the range of 30-50%. The increase in the value
of the AMO indicates that the body has to increase the cost of energy to maintain homeostasis.
2. The width of the histogram shows the corridor of variability of cardiac cycle (RR-interval). In a healthy person,
a narrow corridor of variability of cardiac cycle - 750-850, wide - 650-1000 MS. Narrowing within the specified
limits of the range of durations of the cycles of heart rate causes the heart begins to wear out, not having time to
recover your energy.
In more detail the physiological significance of indicators of spectral analysis and Histogram were examined in the article:
Nonlinear dynamics
The Nonlinear Dynamics software module allows you to explore the chaotic nature of the heart rate, the fluctuations in the recording process, the fractal, self-similar structure of the signal.
To get started, select an assessment and go to Results – Academic – Nonlinear Dynamics tab.
The tab consists of five subtabs containing four thematic units: Phase Portrait, Wavelet Transform, Detrended Fluctuation Analysis, Entropy and Fractality.
The first unit, Phase Portrait, contains 3 graphs:
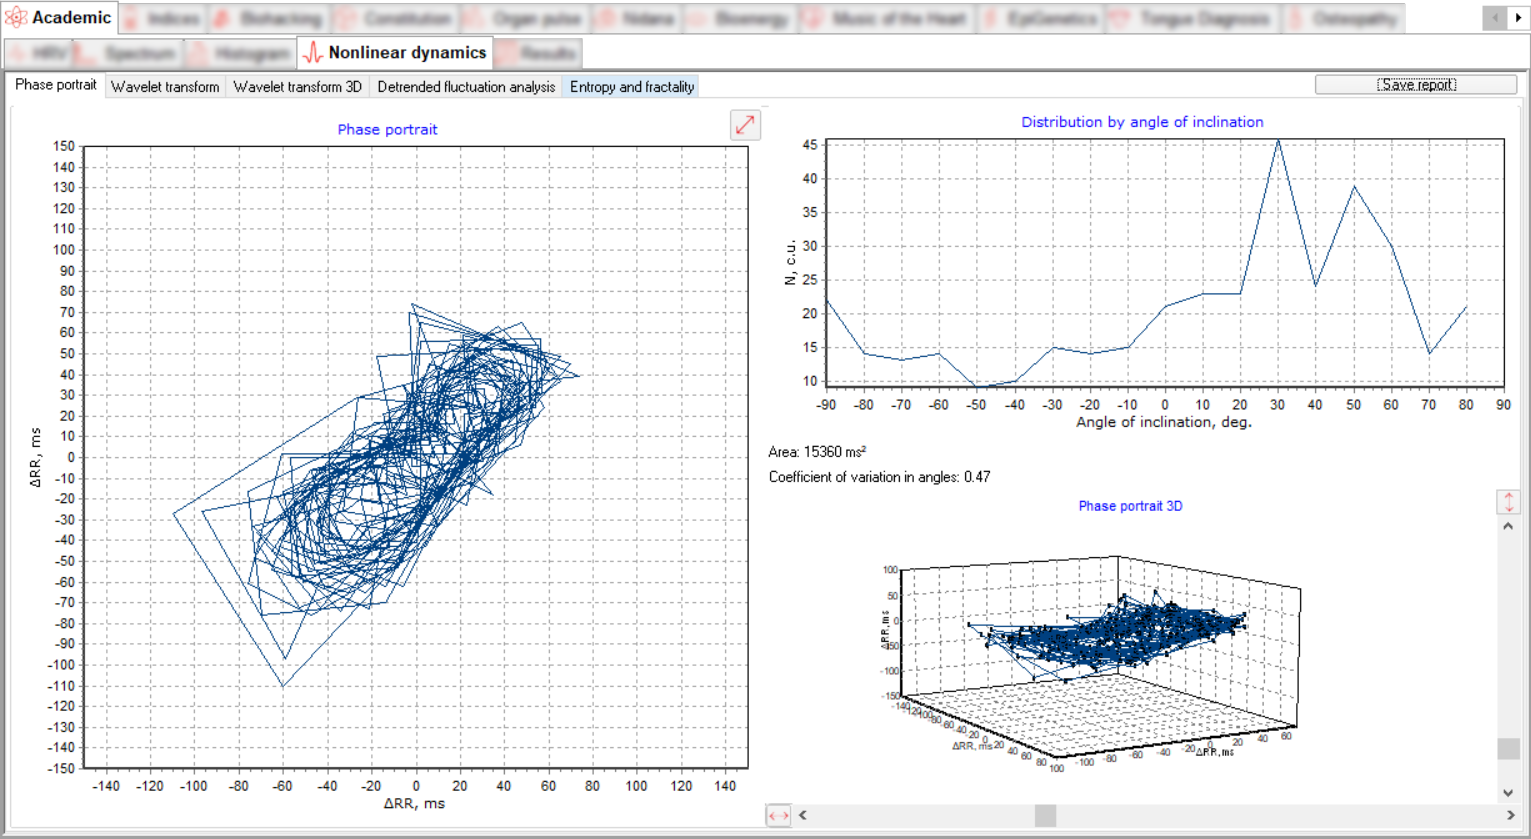
Phase portrait (dynamic chaosogram) is the geometry of sequentially connected points in the phase plane whose coordinates are increments of neighbouring cardiointervals.
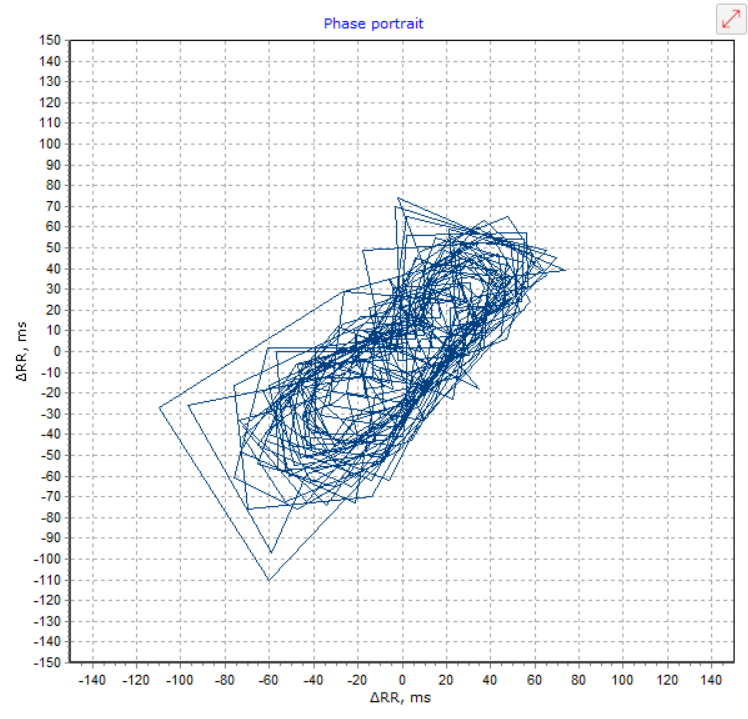
![]() icon allows you to scale (stretch or compress) the graph by content.
icon allows you to scale (stretch or compress) the graph by content.
3D Phase portrait (dynamic chaosogram) is the geometry of sequentially connected points in phase space whose coordinates are increments of neighbouring cardiointervals.
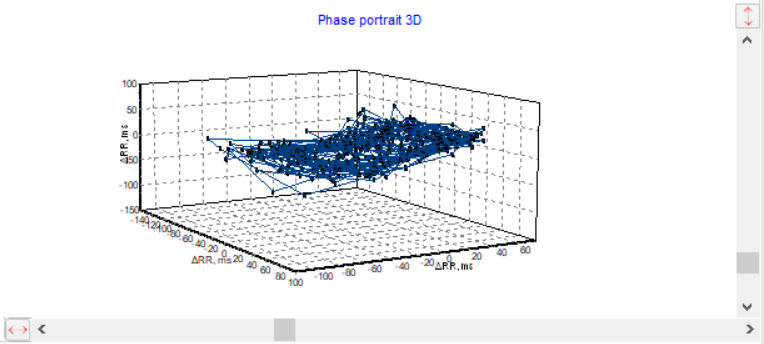
There are two scroll bars – the vertical one rotates the chart around the horizontal axis, and the horizontal one rotates around the vertical one.
![]() and
and
![]() icons are located near each scrollbar. They return the rotation angles to the default ones.
icons are located near each scrollbar. They return the rotation angles to the default ones.
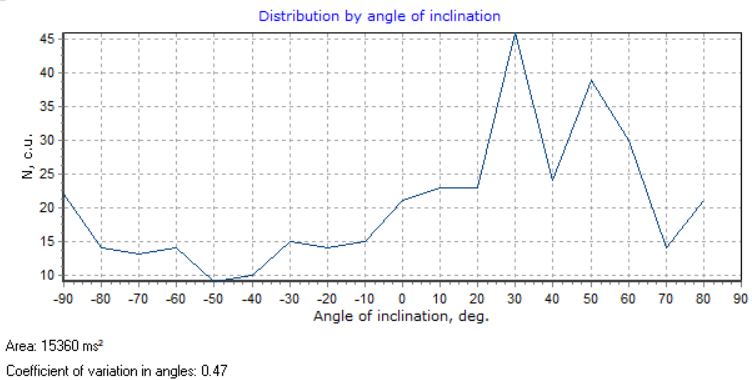
Distribution by angle of inclination – the number of segments of the chaosogram falling within the angle ranges in 5 degree increments is calculated and derived, the area of the chaosogram and the coefficient of variation by angle are also calculated.
The shapes of chaosograms are extremely sensitive. The heart rate fluctuations reflected in chaosograms are based on limit cycles. At the same time, healthy people are characterized by stable ellipsoidal cycles with a single point of attraction, which is reflected in the spider-like appearance of the chaosograms. When the sympathoadrenal regulation department is activated, the size of such an ellipse decreases. On the contrary, when vagal regulation is dominant, it increases. The point of attraction is maintained.
A chaosogram with frequent paroxysmal extrasystoles is associated with an acute-angled triangular generator. Triangular trajectories indicate tension and instability. There are zones of instability (ectopic foci) and the system jumps from one unstable state to another. Patients with acute coronary syndrome are characterized by such chaosograms, and the more acute stages coordinate with the sharper angles of the vertices of the triangle.
Chaosograms from patients with atrial fibrillation are characterized by the formation of lines whose size and orientation change randomly. There is no point of attraction, which indicates a disorganized heart rhythm.
Finally, patients with postinfarction cardiosclerosis have a rigid rhythm. At the same time, the chaosogram degenerates into a spatial shape of the "bagel" type.
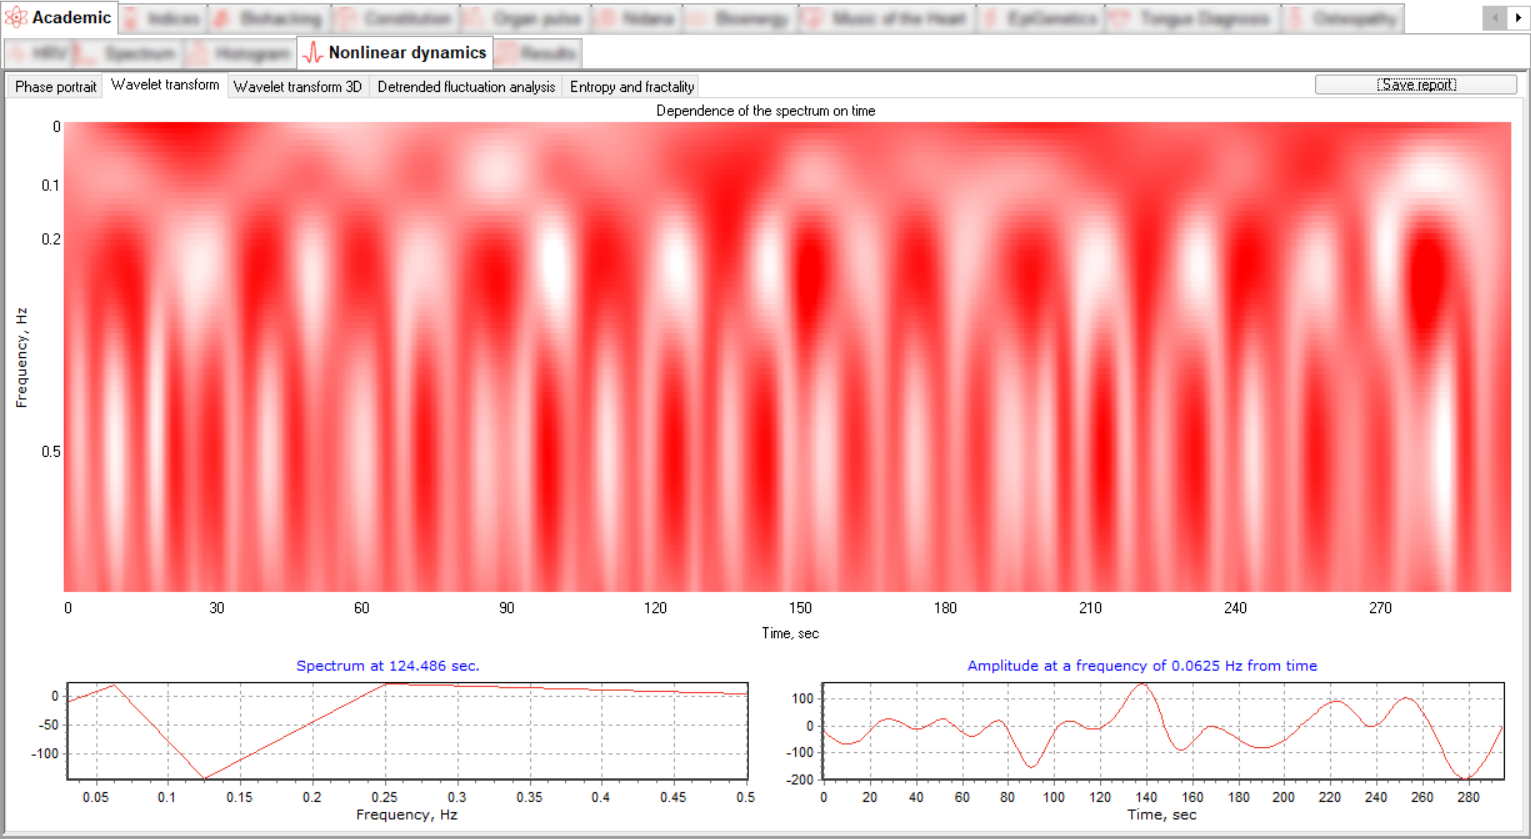
The second unit displays the time-frequency representation of the signal and consists of 2 subtabs: Wavelet Transform and Wavelet Transform 3D.
These subtabs allow you to follow changes in the spectrum in both time and frequency simultaneously. This visualization method allows frequency analysis of individual ECG recording segments.
The Wavelet Transform subtab contains an interpolated Wavelet scalogram and two dynamic graphs - spectral and time decomposition of the signal, located at the bottom of the tab. The values on the graphs change on mouseover different sections of the graph (time and frequency).
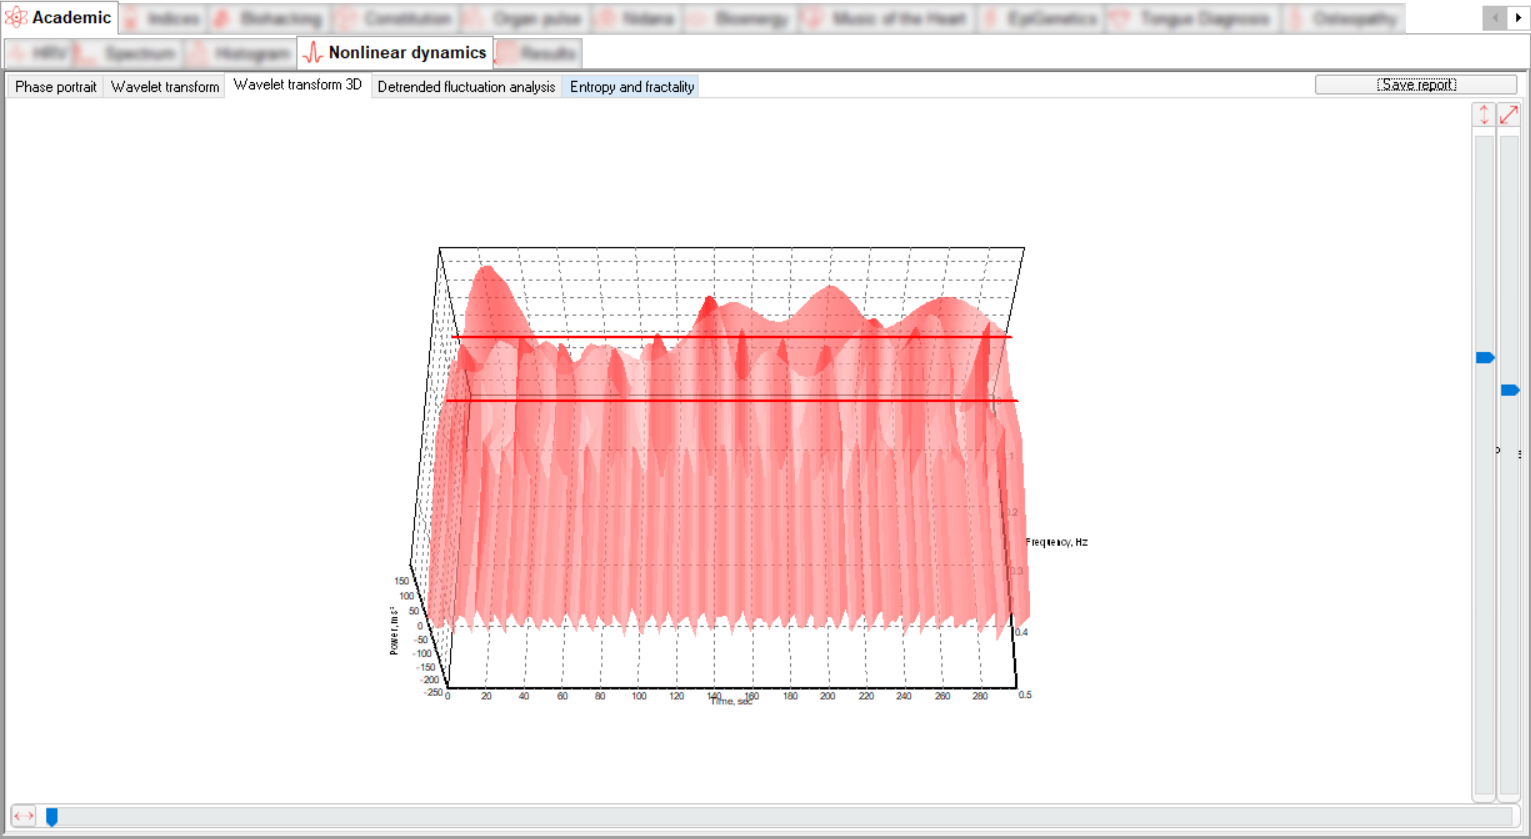
The Wavelet Transform 3D subtab contains a three-dimensional graph of the wavelet transform. There are three scrollbars - the rightmost vertical one allows you to change the scale of the graph, the next vertical one rotates the graph around the horizontal axis, and the horizontal scrollbar rotates around the vertical one. The red lines are drawn at frequencies corresponding to transitions across different spectral ranges: 0.04 Hz (VLF - LF), 0.15 Hz (LF - HF).
![]() and
and
![]() icons reset the rotation angles to the default.
icons reset the rotation angles to the default.
![]() icon allows you to restore the original scale.
icon allows you to restore the original scale.
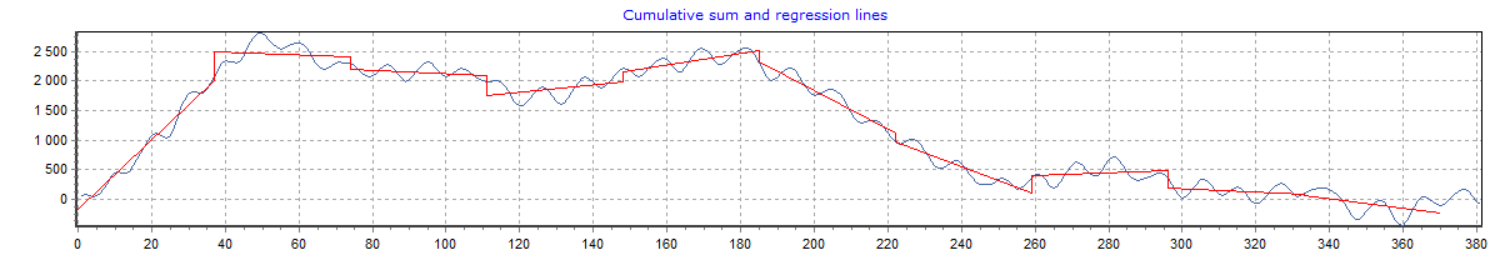
The third unit – the Detrended fluctuation analysis subtab contains two graphs:
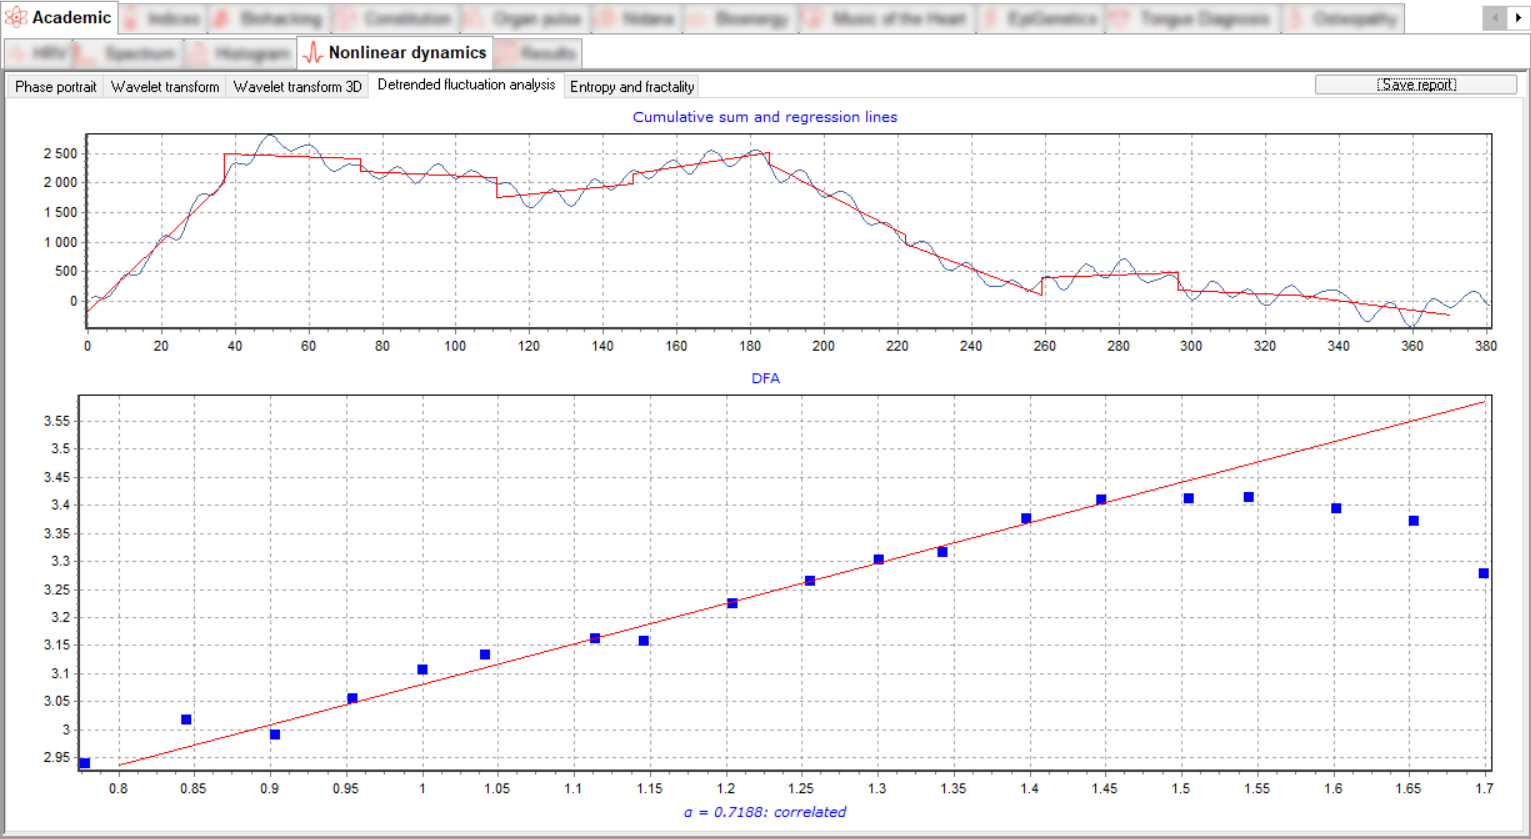
The Cumulative Sum and Regression Lines graph shows the first stage of calculating the DFA alpha coefficient, calculating the cumulative sum and identifying the main trend with regression lines (by the example of 10 segments).
The DFA graph shows the points of deviation from the regression on different scales (from 6 to 50 segments) and the regression line along them, in logarithmic scales, the tilt angle of the line corresponds to the coefficient α.
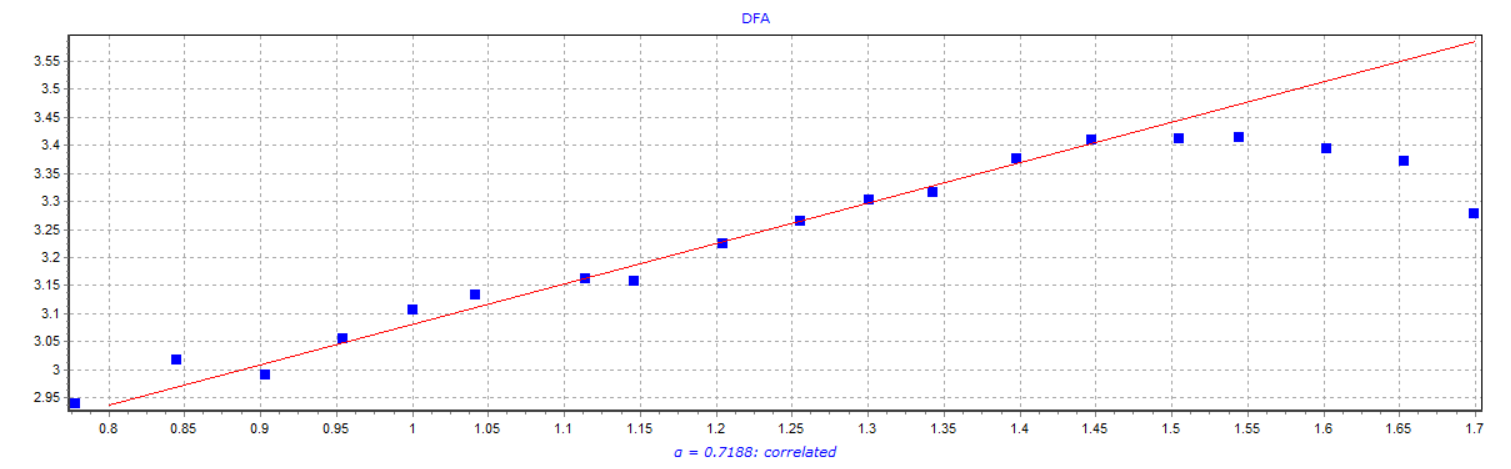
Values of the α coefficient:
α < 1/2: anticorrelated
α ≈ 1/2: uncorrelated white noise
α > 1/2: correlated
α ≈ 1: 1/f noise, pink noise
α > 1: nonstationary, infinite
α ≈ 3/2: Brownian noise
DFA analysis makes it possible to detect the properties of self-similarity inherent in the time series, and also avoids artifact trends.
DFA αcan be interpreted as the noise index of the underlying dataset. Larger alpha values indicate greater correlation at various scales, while smaller values indicate less correlation and in some sense more chaotic and random data.
The heartbeat becomes more chaotic as it is subjected to increased acute stress caused by physical exertion. For example, DFA alpha drops below 0.75 at the aerobic threshold and below 0.5 at the anaerobic threshold.
The fourth unit – the Entropy and Fractality subtab, contains a graph for analyzing the fractal structure of a time series in double logarithmic coordinates and a regression line whose tilt angle corresponds to the Hurst indicator, as well as a table of values for various indicators.
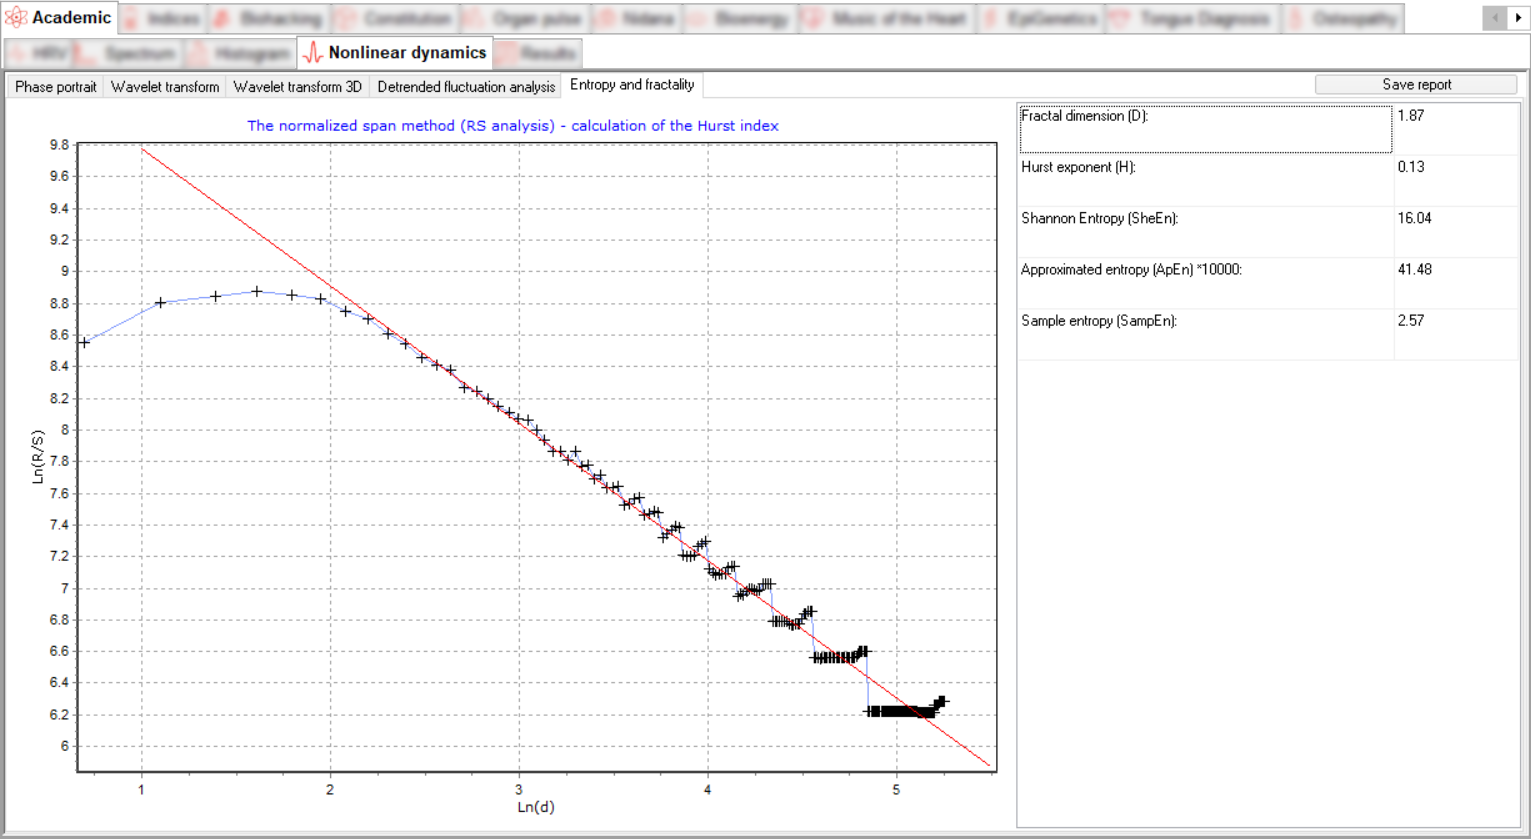
The Fractal dimension is an indicator of the complexity of the process, the magnitude of which makes it possible to predict the behaviour of the system and diagnose unstable states. The application of a non-linear dynamic approach allows us to assess how the study system functions (regularly or irregularly, and if irregularly, to what extent) and to determine the complexity of its dynamics.
The Hurst exponent H is used as a measure of the randomness of time series data. It estimates the autocorrelation of time series and the rate at which it decreases with increasing time between pairs of values. It quantifies the relative tendency of a time series to either strongly regress towards the mean or to cluster in a particular direction.
| Value | Description |
|
0 |
There are no movements at all or they are cyclical movements with a very high frequency of oscillation. |
|
0 < Н < 0,5 |
Non stable series (anti-persistent). |
|
0,5 |
Absolutely random series |
|
0,5 < Н < 1 |
Trend-resistant (persistent) series |
|
Н > 1 |
A very rare phenomenon. Independent amplitude jumps occur |
Shannon entropy expresses the uncertainty in the realization of a random variable. Thus, entropy is the difference between the information contained in the message and the part of the information that is exactly known (or well predictable) in the message.
Approximated entropy (ApEn) characterizes the degree of complexity of the signal. The more pronounced the regular component of the signal, the lower the value of this measure, and vice versa.
A significant decrease in entropy is most often accompanied by pronounced clinical manifestations of a negative prognosis of the disease or its negative dynamics. Low entropy indicators in combination with a decrease in vagal activity accompany the defeat of the autonomic nervous system in diabetes mellitus and the formation of polyneuropathy
Sample entropy (SampEn) — is a modification of the approximate entropy (ApEn) used to estimate the complexity of physiological time series of signals diagnosing morbid states.
By clicking on the Save Report button, you can generate a detailed report, including all charts and indicators. This report can be saved to a file or printed.
Indices
Indices software module is designed to assess general health level and vital energy, metabolic stress, immunity condition, rate of biological aging, inflammatory threshold, stress level, as well as psychoemotional state of a client.
This module is useful for demonstration to the patient. If the previous tabs: HRV, Spectrum, Histogram - require special knowledge, Indices had been adapted for the perception of the layman. Use this tab every time you want to convey information about patient's condition and about the dynamics of rehabilitation to him. Consistently review the assessments made in the process of rehabilitation together with the patient.
The module consists of 3 tabs: Energy, Metabolism, Psychophysiology.
Energy
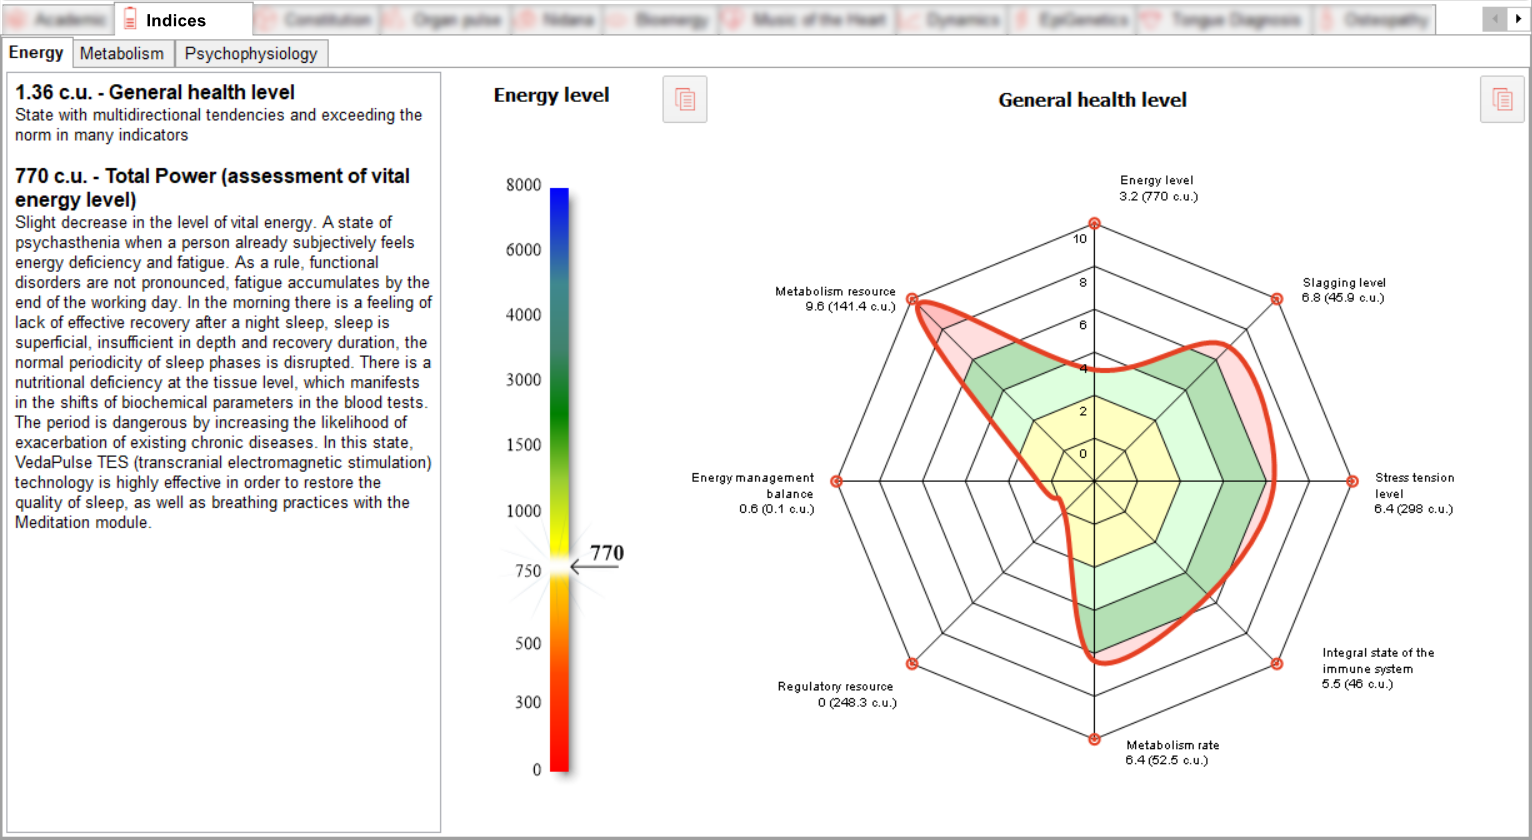
The Energy tab displays Energy level index and General health level chart.
The Energy level index clearly reflects the vitality supply. With the help of the index, various ranges of energy level changes are visualized:
• Regulatory range;
• The range of a slight decrease in the level of energy, psychoasthenia;
• The range of a significant decrease in energy levels, astheno-neurotic syndrome;
• Range of very significant reduction – neurovegetative syndrome;
• The range of high risk of manifestation of genetically determined (Prakriti-dependent) diseases;
• Excess resource range;
• Energy stagnation range.
Please note that the index scale values are presented non-linearly, with equally spaced intervals, for better visualization.
When the cursor is hovered over the index scale, tooltips appear explaining the physiological significance of the calculated value.
The General health level chart allows you to take a fresh look at the main indices of the VedaPulse Professional in order to make a comprehensive assessment of a person's state of health.
The chart shows the following indices:
• Energy Level (TP)
• Slagging level (Metabolic Stress level)
• Stress tension level (Stress level)
• Integral state of the immune system (Adaptation level)
• Metabolism rate (Rate of biological aging)
• Regulatory resource (IC)
• Energy management balance (LF/HF)
• Metabolism resource (PAPR)
For ease of comparison, all indices on the graph are displayed in the range from 0 to 10:
0-2 – Decreased level of the index
2-4 – Tendency to decreased level
4-6 – Normal state
6-8 – Tendency to exceed the norm
8-10 – Excess of the norm
All indices have pop-up tips explaining their physiological significance.
You can see the value of the General health level index in the text field. This value is calculated on the basis of an assessment of the levels of the graph indices as a whole and taking into account multidirectional trends.
Both graphs can be copied to the clipboard using the
![]() .
.
Metabolism
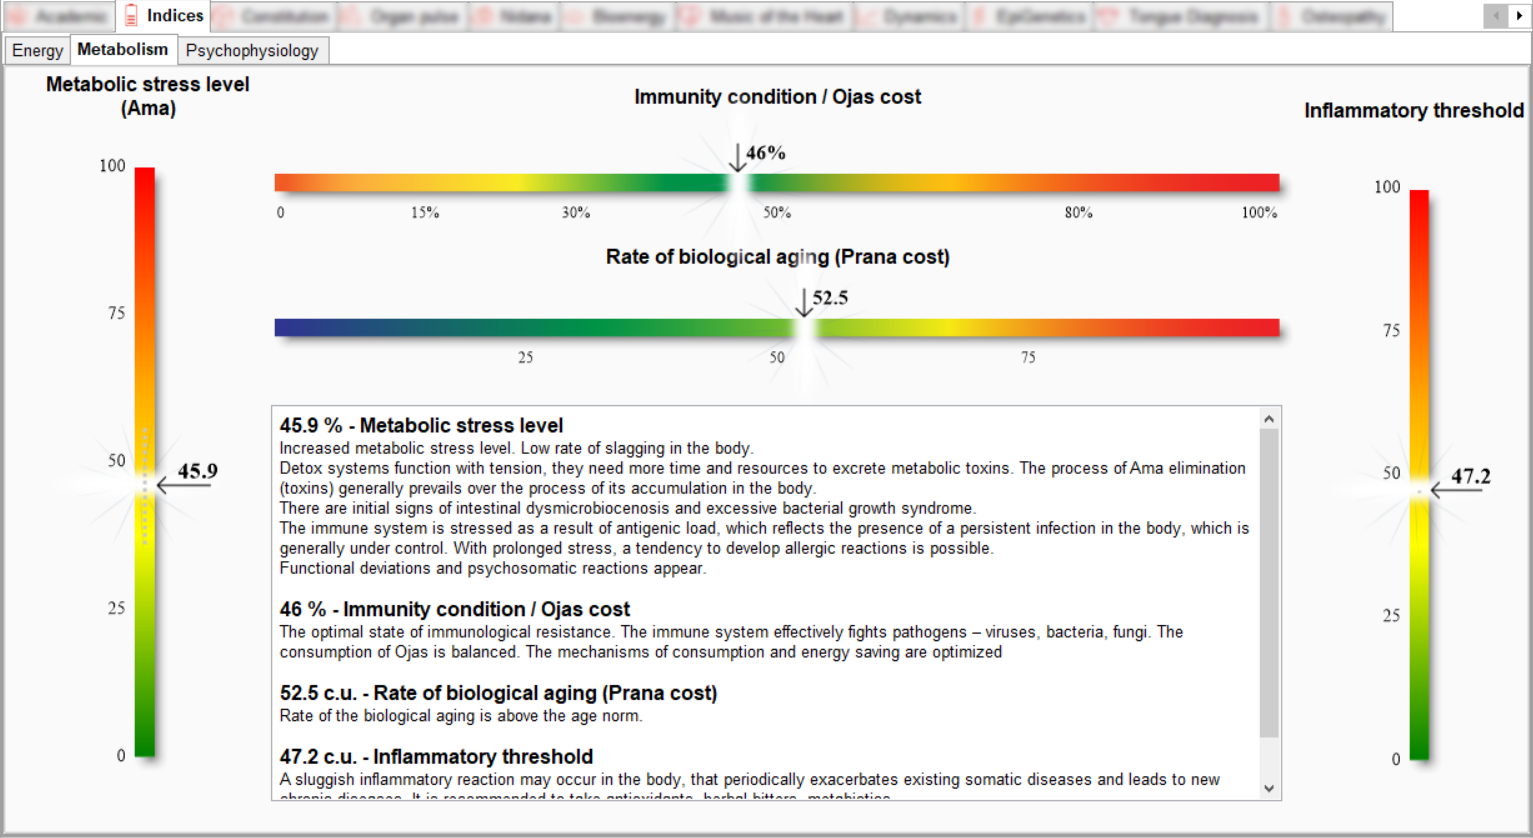
Metabolism tab contains 4 main health indices with interpretation of the physiological value of the data:
Metabolic stress level (Ama) (0 – 100%) index reflects the effectiveness of Detox systems (liver, kidneys, colon microbiota, Apana Vata system, Dhatu Agni) as well as accumulation and elimination of intermediate metabolic products (Ama or toxins). The index is actively used by specialists when conducting Detox programs in order to monitor the effectiveness of the program.
Immunity condition / Ojas cost (integral state of the immune system) (0 – 100%) index assesses the level of immunological resistance to viruses, bacteria and fungi. The index reveals a tendency to the development of immunodeficiency, allergies and autoimmune pathology. Shows the degree of Ojas consumption.
Rate of biological aging (Prana cost) (0 – 100 units) index evaluates the rate of energy cost (Prana, Qi) on the course of metabolic processes. Its changes indicate the presence of hormonal dysfunction and reflect the rate of aging of the physical body. The indicator is calculated on the basis of the theory of oxidative stress. This coefficient reflects the rate of oxidative processes in the body that affect the rate of ageing. It is not an indicator of how old a person is, but an indicator of how much the ageing process is going on at the time of the assessment. If the indicator is in the range of 25-50, it means that the ageing process corresponds to the age norm.
Inflammatory threshold (0 – 100 units) index reflects the activity of anti-inflammatory and antioxidant systems, the presence of acute or aggravated chronic inflammatory process. Reflects the risk zones of chronic inflammatory diseases exacerbation. Allows effective control of anti-inflammatory therapy.
Each index has a visual scale of norm and pathological deviation, as well as an automatically generated text block of individual index descriptions for each patient.
All indices have pop-up tips explaining their physiological significance.
Psychophysiology
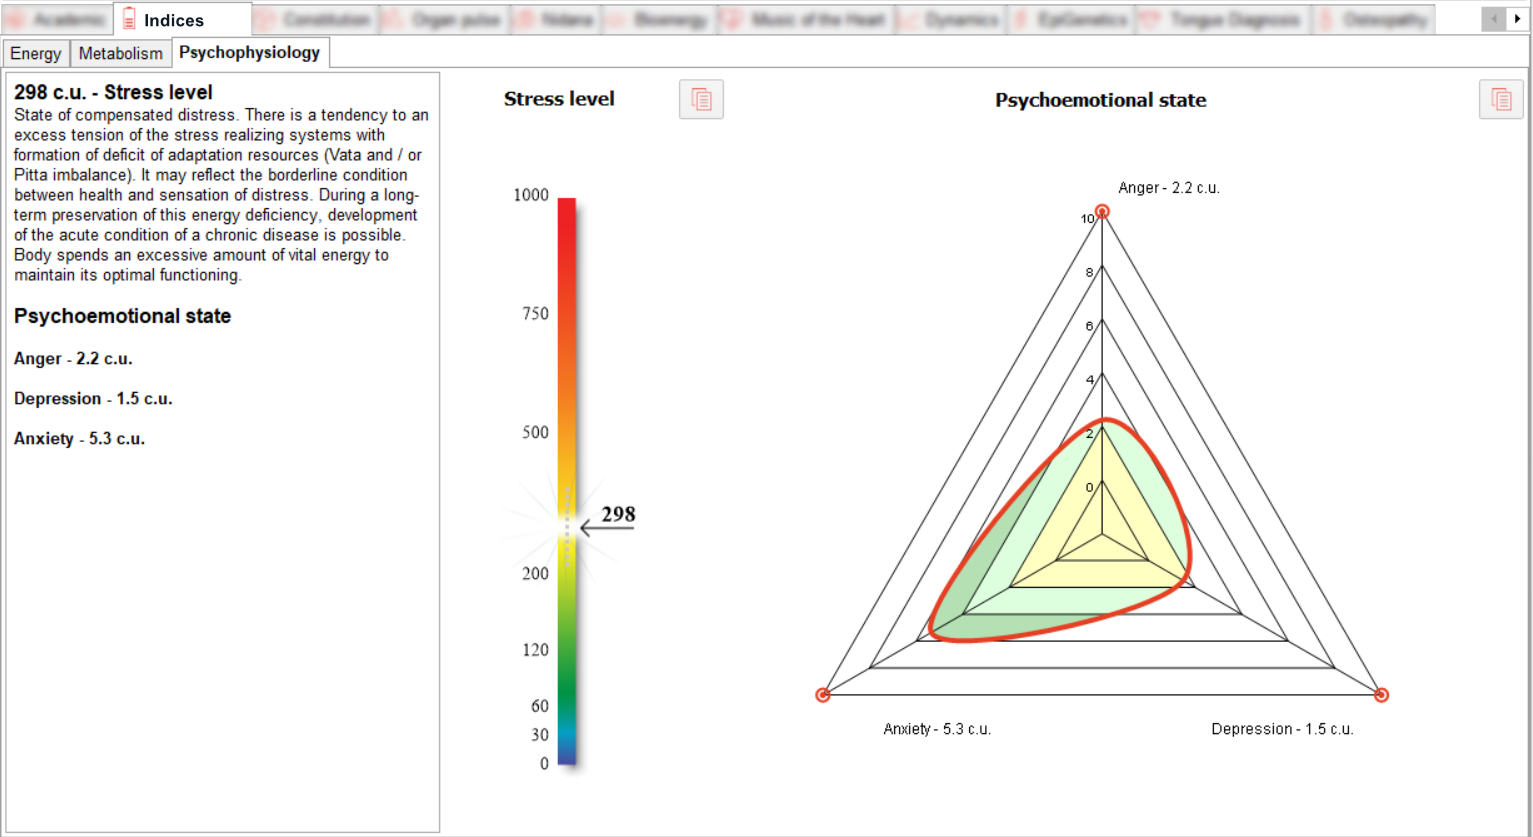
Psychophysiology tab contains 2 graphs: Stress level and Psychoemotional state (anger, anxiety, depression).
Stress level index reflects the presence of autonomic dysfunction in the regulation of internal organs, the severity of psychosomatic processes, the level of anxiety, the activity of stress-implementing systems, the presence of an oxidative stage of stress. Allows the specialist to evaluate objectively the effectiveness of anti-stress programs, clearly demonstrating the result to the patient.
Psychoemotional state allows the identification of acute/reactive (e.g. reactive anxiety) and chronic (depression) states.
Both graphs can be copied to the clipboard using
![]() .
.
Constitution
Constitution software module is designed to identify the constitution type from the perspective of Ayurvedic, Chinese medicine, as well as modern approaches in physiology.
Module contains 2 tabs: Balance (Ayurveda), Syndromes (TCM).
Balance (Ayurveda)

Balance (Ayurveda) tab consists of 3 sub tabs: heuristic analysis of Dosha Balance, Gunas, Prana-Tejas-Ojas.
Dosha Balance sub tab contains information about the characteristics of the pulse from the position of Ayurveda, Dosha balance and heuristic analysis of Dosha balance probability, as well as a graph of Physiological trends in body functions regulation.
The pulse characteristics
Includes the following indices:
• Vega - frequency/speed
• Tala - balance of heart rate
• Bala - power of pulse
• Tapamana – digestive fire
These indicators of heart rate are important for Ayurvedic specialists. The use of authentic terms makes computer diagnostics more comprehensible to specialists mastered the traditional palpation and pulse diagnosis. Also, these pulse indicators are taken into account when designing " Physiological trends in body functions regulation".
Dosha Balance
Reflects Doshas state according to the graph on the right.
Heuristic analysis of Dosha balance probability
It shows the probabilities of dosha types for this assessment, allowing the monotype, dual or tridosha type to be determined as a percentage.
The algorithm also shows the calculation of Dosha balance probability for non-obvious dual types. In this case the probabilities are derived for two dual types simultaneously.
Graph Physiological trends in body functions regulation
This chart reflects the balance of 3 doshas: Vata, Pitta and Kapha from the position of Ayurveda.
The ratio of the three elements is used to generate all personalized recommendations in the software modules included in the rehabilitation unit.
Ranges:
0-1 (yellow) — cachexia (kshaya), high chance of physiological disorders
1-2 (light green) — tendency to exhaustion, possible functional disorders
2-4 (green) — normal (when all 3 doshas are within this range, it is tridosha state)
4-5 (light green) — tendency to aggravation, possible functional disorders
5-7 (pale red) — aggravation, imbalance state, high chance of physiological disorders
7-8,5 (red) — strong aggravation, which cause critical symptoms
The graph can be copied to the clipboard using
![]() .
.
The concept of human Constitution includes many factors: body type, psychological and physiological manifestations. Computer pulse diagnosis "VedaPulse" defines physiological manifestations of each constitutional type. They are crucial for the selection of treats. Defined type, which comes in the form of the ratio of VATA, PITTA, KAPHA (VPK), may be modified in the case of re-assessment. This is normal. We all are humans, and these modifications reflect the natural fluctuations and changes in the activity of different physiological systems of regulation. But if you look closely at the results of measurements made on different days, in most cases, it will reflect the same tendency, peculiar to this man at this stage of his life. That is the dominant one of the three or two factors will be found. Of course, it is advisable for each patient to be observed for some time and, only after ensuring of the stability of the result, proceed to use herbs, aromatherapy, diet and dietary Supplements. If repeated measurements of a small percentage of the results will show a different dominant VPK factors, then these results can be neglected, as they are likely to reflect the effect of any short-term factor. So don't worry when you discover that repeated measurements are different. It is important to identify the most frequently recurring trend. But having identified this trend, the most typical for the individual measurement results should be taken as a basis. Then one should follow the recommendations on therapy for the most typical option.
After regular intake by the person individually balanced for him therapeutics, current constitutional type is being modified gradually, and this will be reflected in smoothing of the contrast as a dominant factor on the chart. A more detailed presentation of topics concerning constitutionally balanced nutrition and therapy are contained in our seminars and webinars.
Gunas sub tab reflects the state of the 3 Mental Gunas – Sattva, Rajas, Tamas – and their connection with Doshas. It consists of a text field and a pie chart.
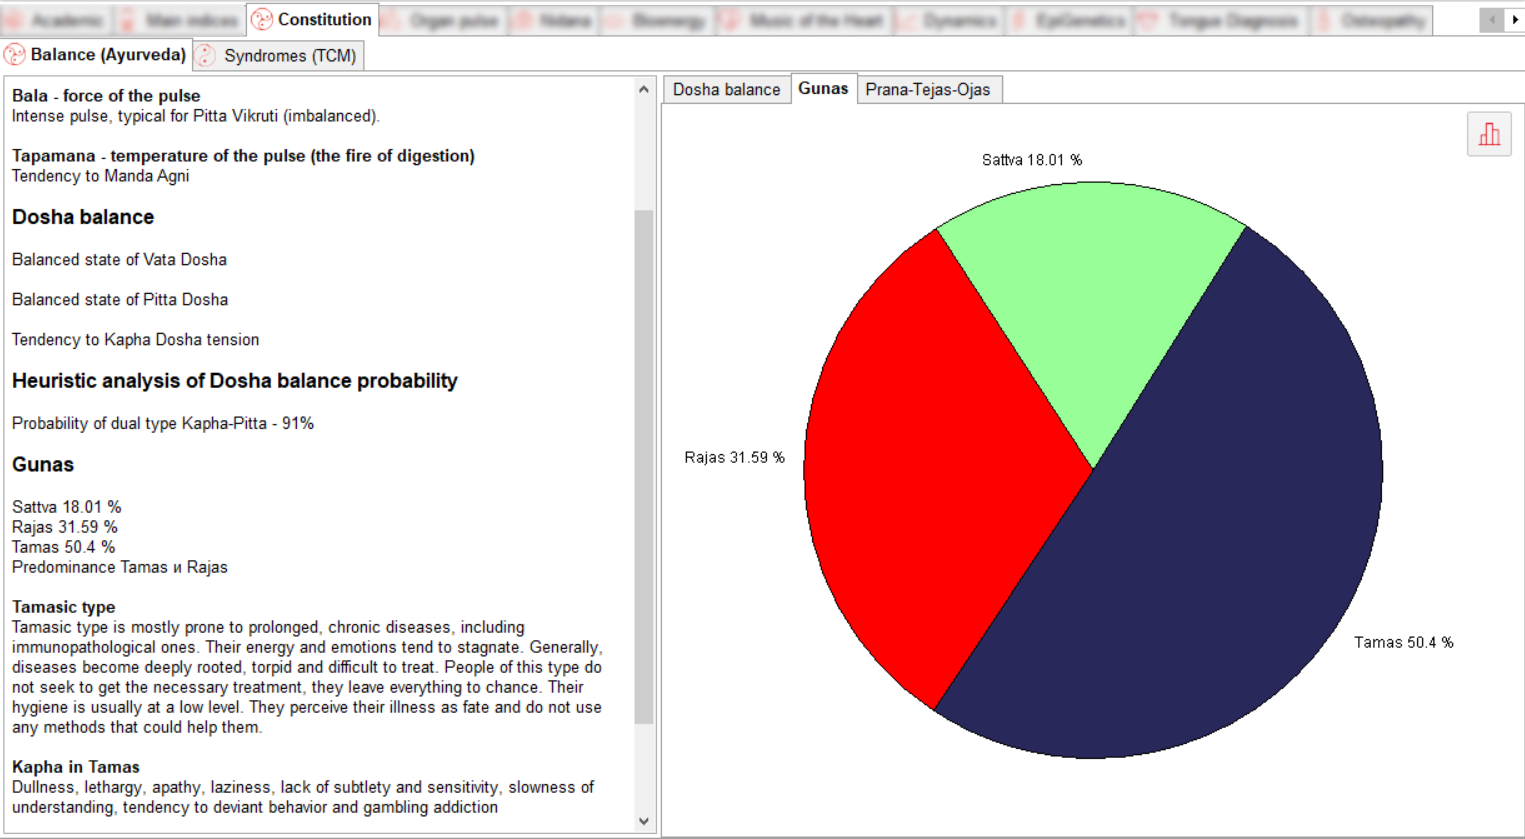
Sattvic type – Sattvic type is less susceptible to diseases than others, nature is harmonious and easily adaptable. Strives for balance and peace of mind, thereby depriving the disease of mental causes. People of this type are attentive to others and take care of themselves. They take life as a necessary experience and try to benefit from everything, including illness.
Rajasic type – Rajasic type are usually endowed with great energy, but they can "burn" themselves with excessive activity. Their symptoms of the disease are usually acute, recovery is possible if the correct therapeutic measures are applied. They are impatient and inconsistent in the treatment of the disease and do not want to waste time for the sake of their recovery or take responsibility for it. They prefer to blame others for their illnesses.
Tamasic type – Tamasic type is mostly prone to prolonged, chronic diseases, including immunopathological ones. Their energy and emotions tend to stagnate. Generally, diseases become deeply rooted, torpid and difficult to treat. People of this type do not seek to get the necessary treatment; they leave everything to chance. Their hygiene is usually at a low level. They perceive their illness as fate and do not use any methods that could help them.
The text field gives information about the proportion of each Guna; if there is a predominant Guna, its description is given, as well as the manifestation of Dosha in that Guna.
The graph can be copied to the clipboard using
![]() .
.
Prana-Tejas-Ojas sub tab evaluates trends (decrease, normal, increase) and determines which of them is characteristic of the patient's Prana, Tejas and Ojas at a given time. It consists of a text field and a bar graph.
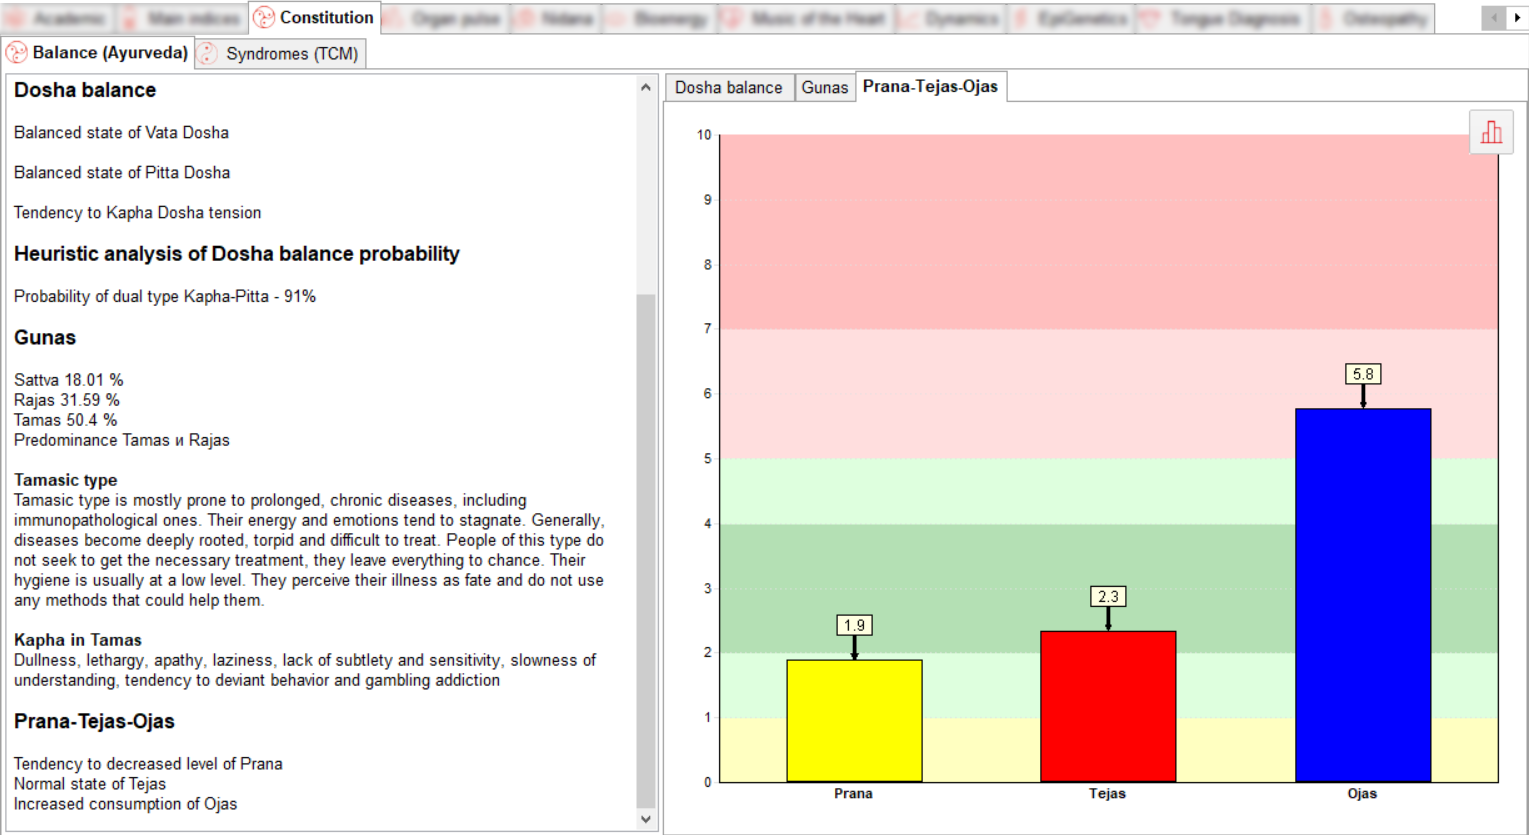
Prana-Tejas-Ojas are three important energies/substances/quintessences that determine energy balance, state of the endocrine system and immunity:
• Prana indicates energy levels.
• Tejas reflects the state of the endocrine system.
• Ojas reflects the state of immunity.
The graph can be copied to the clipboard using
![]() .
.
Syndromes (TCM)
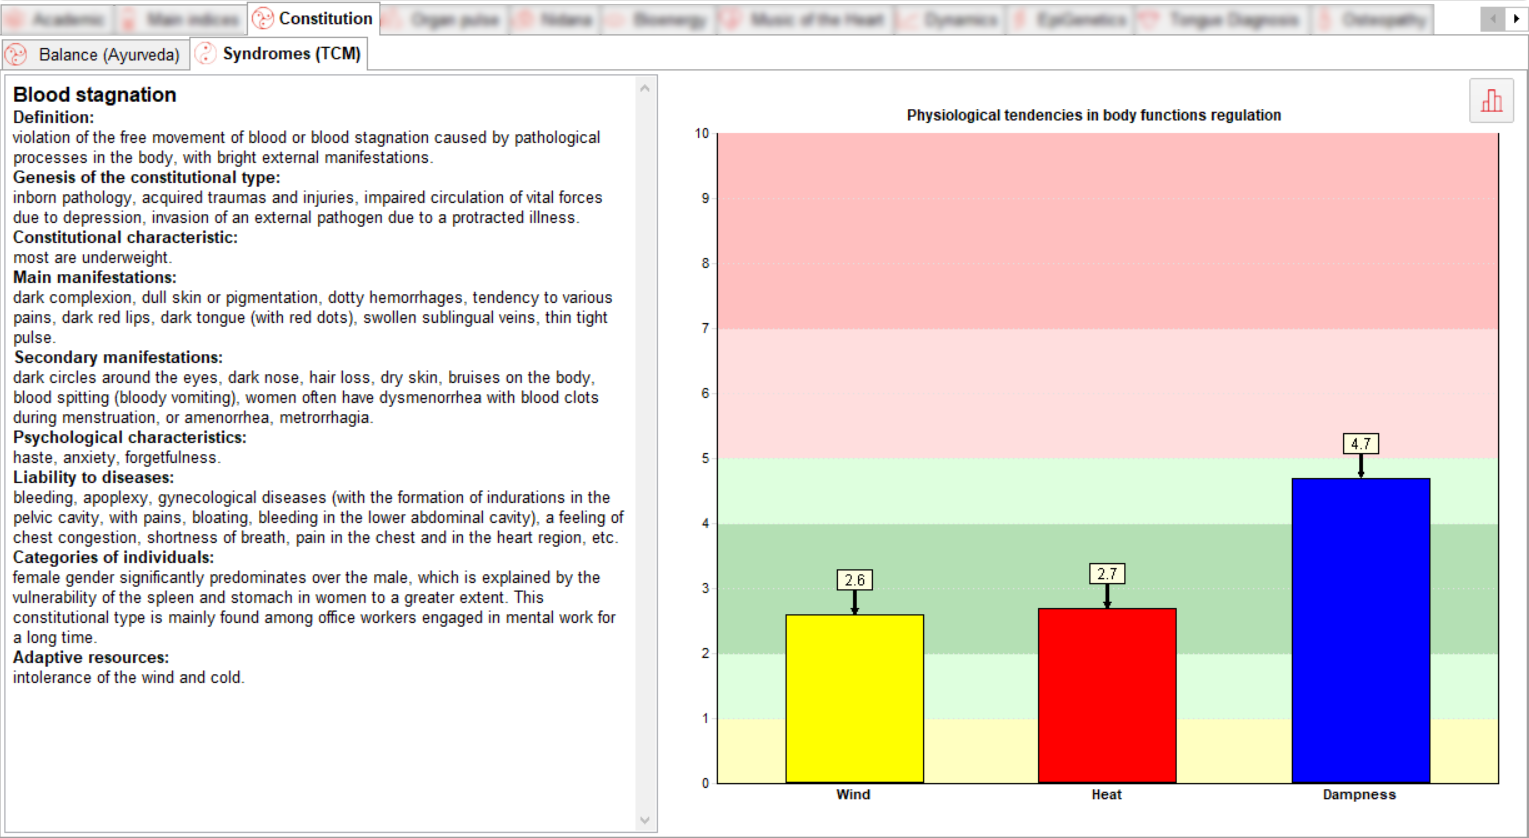
This tab contains information on TCM syndromes (constitutional characteristics, manifestations, psychological characteristics of the type, susceptibility to disease, adaptability) and a graph reflecting the ratio of 3 elements from the perspective of Chinese medicine: wind, heat and dampness.
The ratio of the three elements is taken into account to create all the personalized recommendations in the expert extensions included in the rehabilitation unit.
Ranges:
0-1 (yellow) — strong depletion, high chance of physiological disorders
1-2 (light green) — tendency to exhaustion, possible functional disorders
2-4 (green) — normal
4-5 (light green) — tendency to aggravation, possible functional disorders
5-7 (pale red) — aggravation, imbalance state, high chance of physiological disorders
7-8,5 (red) — strong aggravation, which cause critical symptoms
The graph can be copied to the clipboard using
![]() .
.
Prakriti
Prakriti tab consists of 2 parts: test and results.
In order to identify a patient’s Prakriti, he needs to fill out a questionnaire. To do this, click on the patient’s card in the catalog on the left and go to the Prakriti Test tab on the right.
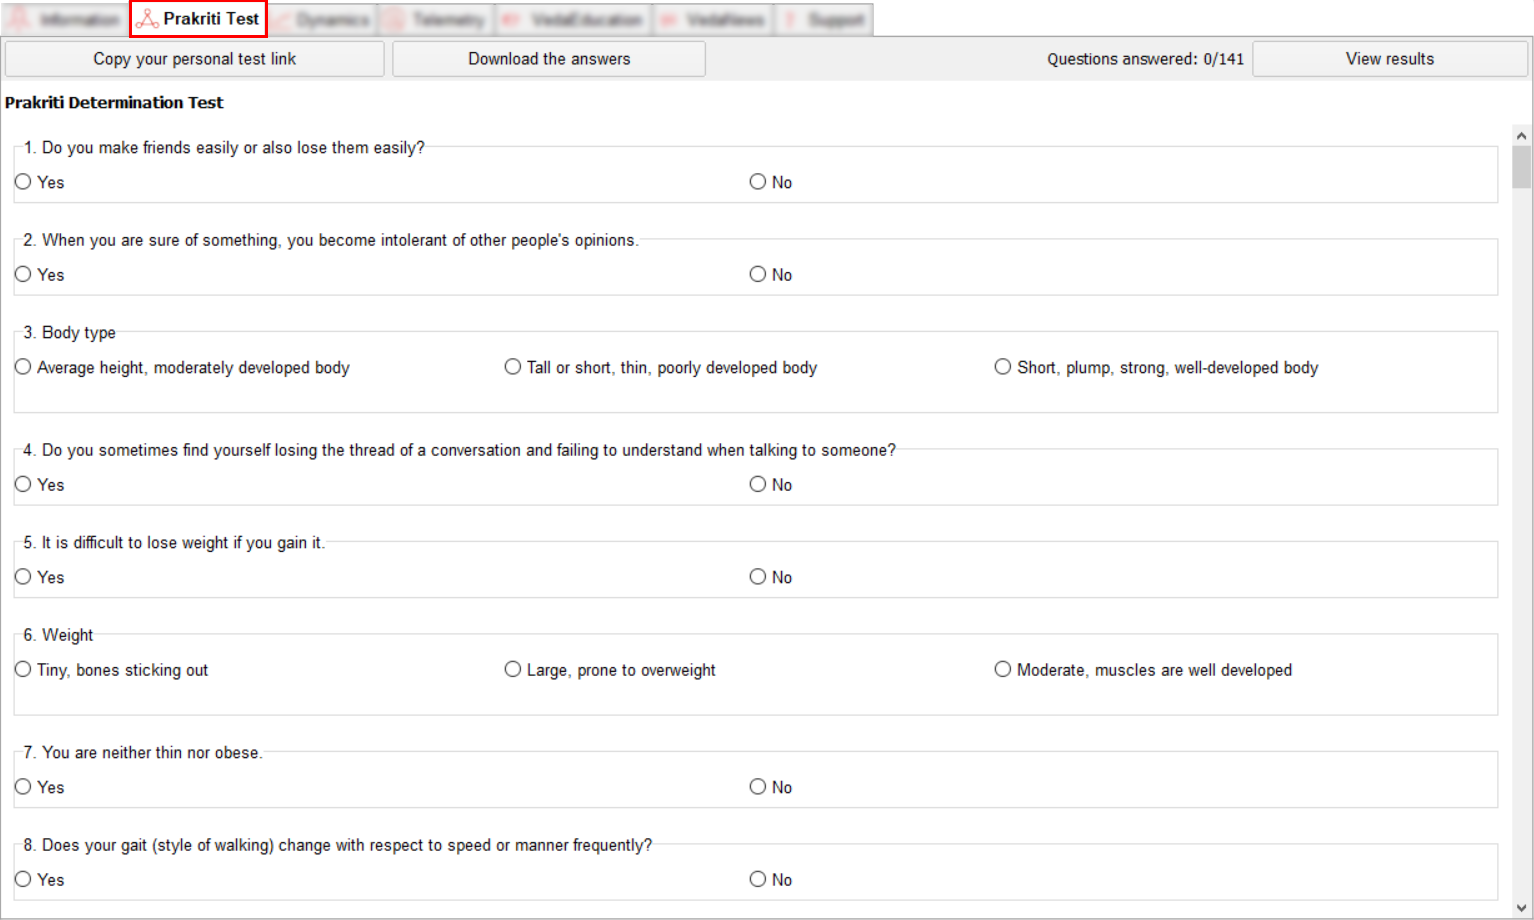
The questionnaire contains 141 questions that the patient should answer.
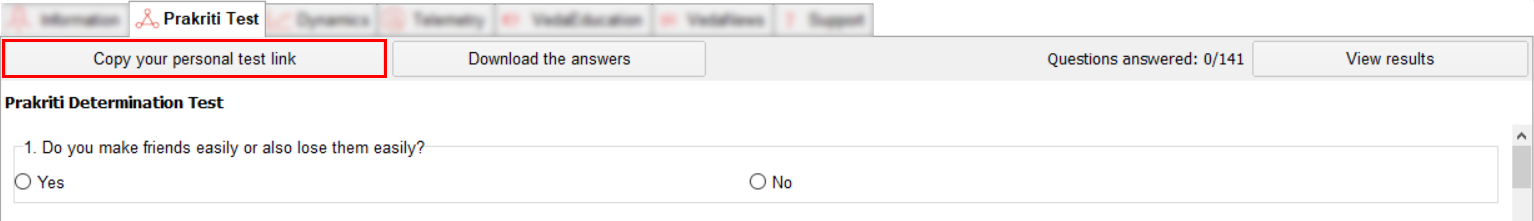
For convenience and time saving, the specialist can send the patient a personal link to the test in advance and then upload the answers. To do this, click on the Copy your personal test link button.
Note: Pay attention that the E-mail field in the patient's card must be filled in.
A new window will open in which the specialist can copy the link using the Copy your personal test link button or scan the QR code.
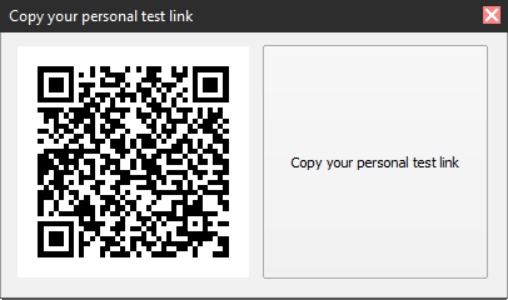
Then send the link to the patient in a convenient way: by e-mail or messenger.
After the patient has completed the questionnaire, upload the answers by clicking on the Download the answers button.
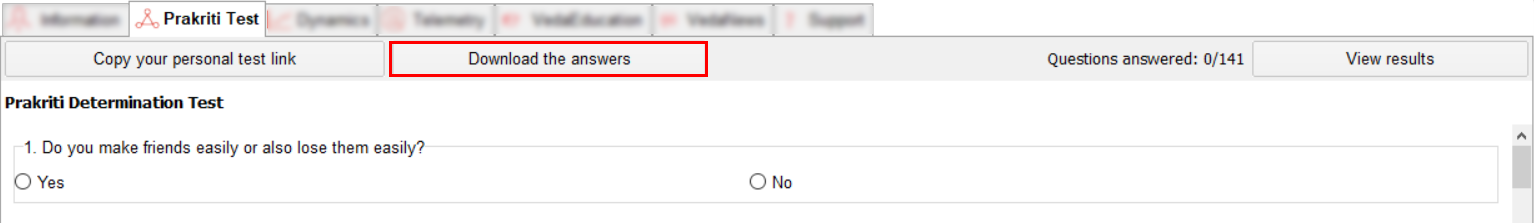
Then click on the View results button.
The results will be displayed in the Prakriti tab of the Constitution software module.
Please note that the data in the tab is filled in only after filling out the questionnaire. Answers to questions can be changed either while filling out or later.
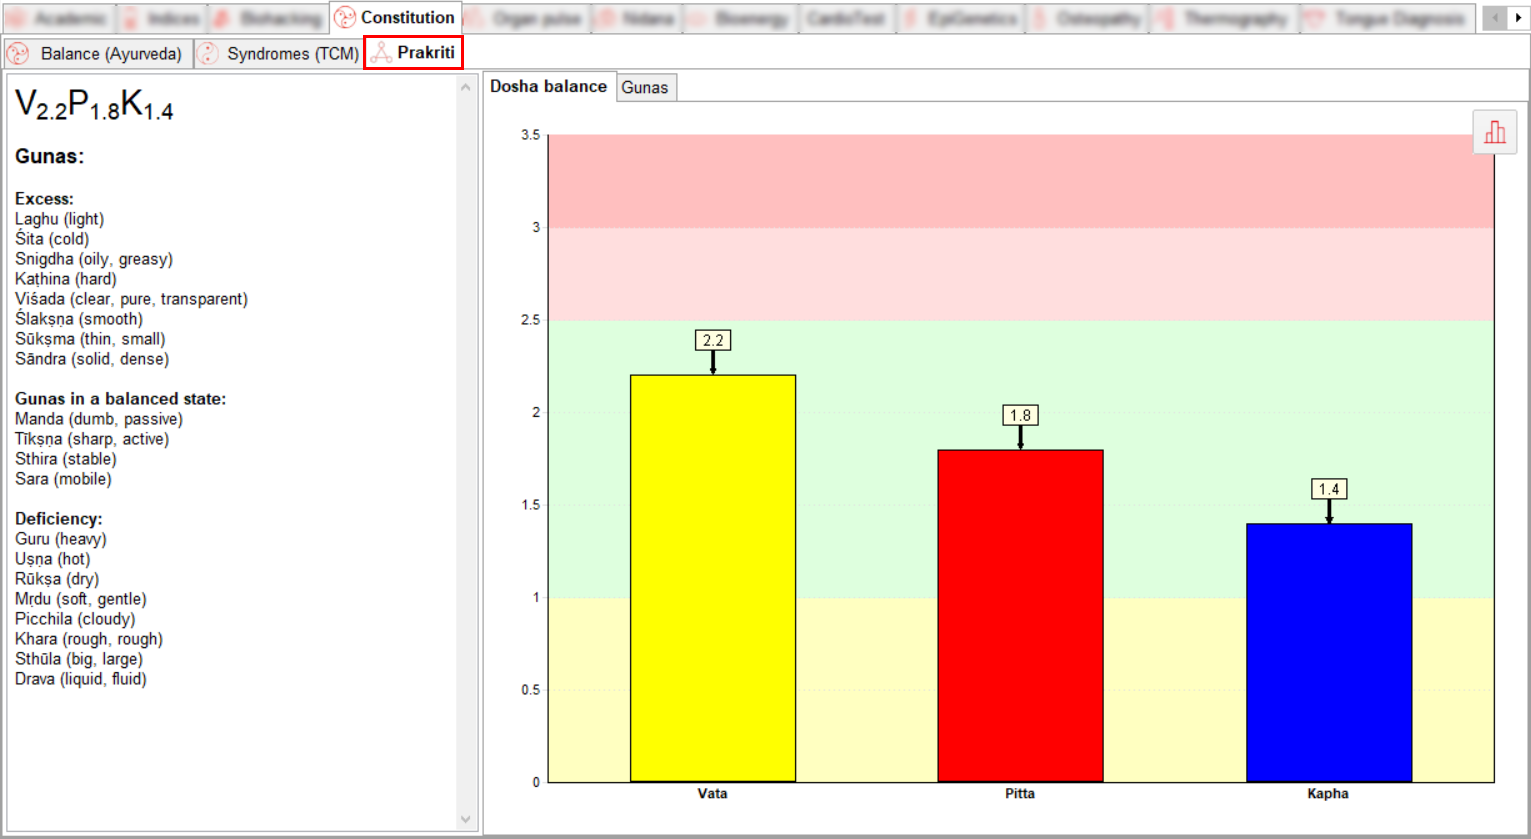
The Prakriti tab contains a text block and 2 subtabs: Dosha balance and Gunas.
The Dosha balance subtab presents a bar chart of the human constitution. The diagram is divided into 4 areas, coloured yellow, green, pink and dark pink, according to the degree of predominance of one or another dosha (yellow - Dosha kshaya, Dosha is decreased, pink - a tendence to the Dosha excitement, dark pink - Dosha is excited).
The
diagram can be copied to the clipboard using
![]() .
.
The Gunas tab presents 10 pairs of Gunas - qualities of the material nature - with an indication of the proportion of each Gunas.
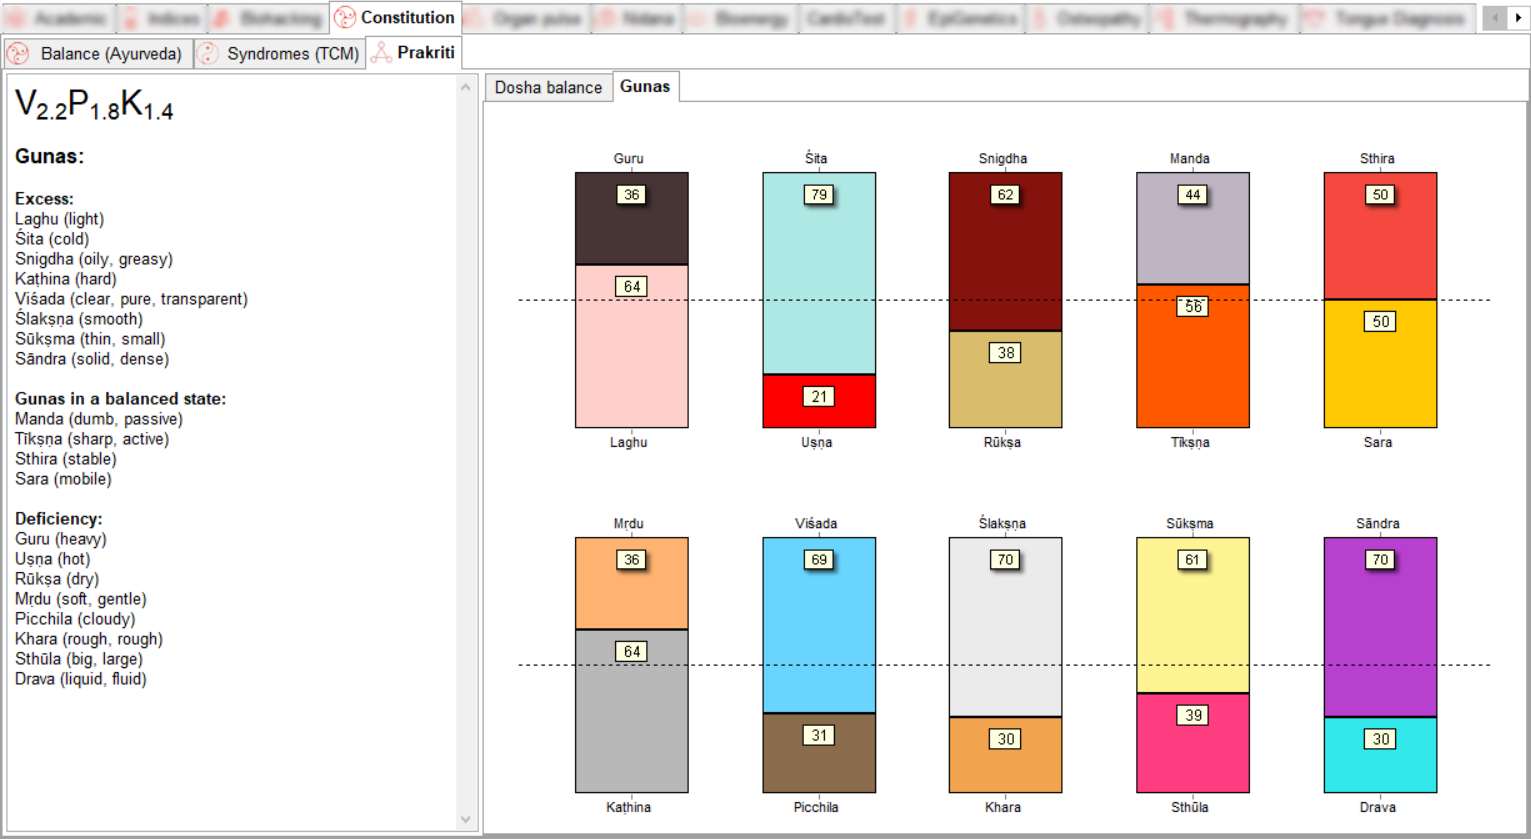
When you hover over the area of a particular Guna, you will see a tooltip with the name of Guna, its quality, the value of the fraction and the main action.
In the text field you can read the report about the constitution formula (on a scale from 0 to 3.5 cu. in accordance with the concept of the guru of pulse diagnosis Dr. Vasant Lad), Gunas in the order of their predominance (excess), balance and deficiency.
Meridians (Organs'pulse)
Contains two tabs: Chinese scheme, Ayurvedic scheme.
Chinese scheme
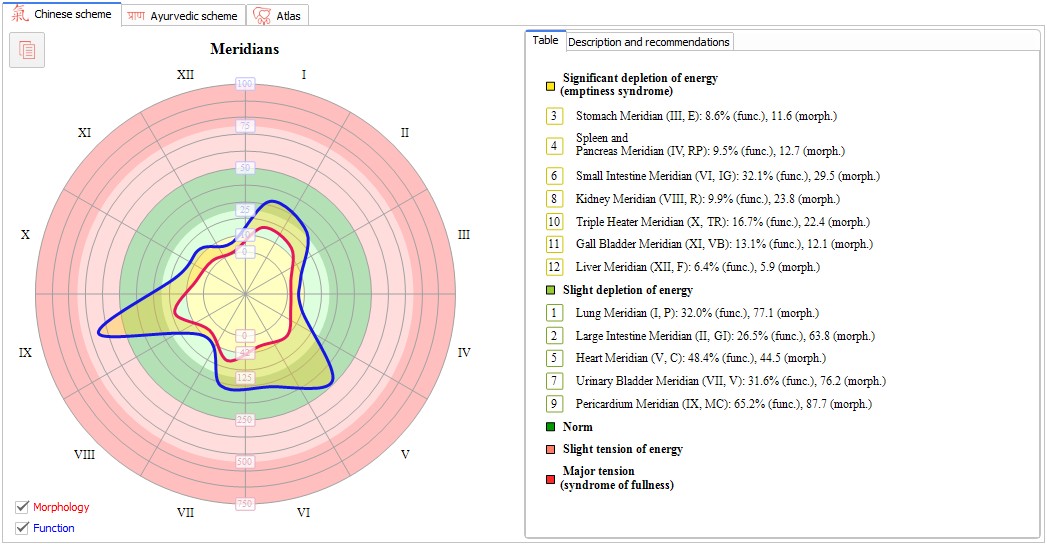
It includes a graph of the functional state of 12 vital organs as per Chinese traditional medicine (TCM).
The list of 12 organs:- Lugs
- Large intestine
- Stomach
- Spleen
- Heart
- Small intestine
- Bladder
- Kidneys
- Pericardium
- Triple heater
- Gallbladder
- Liver
European medicinal system uses the term "Organ" for mere denoting the independant physiological organs, while TCM has quite a broader concept standing behind it — and the closest to European view correspondance here is "the functional system".
For example, the "Spleen" in traditional Chinese medicine is in charge of the entire digestive system, it covers: the stomach, small intestine, large intestine, liver, gall bladder and pancreas — the actual physiological organs, which gave the names for the "Organs" in traditional Chinese medicine. At the same time, the role of the spleen as a physiological organ is much narrower — fine blood purification, removal of obsolete blood cells and platelets, hemoglobin processing.
This is described in more detail in the article "Twelve main meridians in traditional Chinese medicine"..
Each channel in the program is provided with a textual description, located to the right from the graph. The description gets open by clicking on the corresponding sector on the graph.
Meridian energy is represented by two graphs - Function and Morphology.
The user can optionally enable the display of any of the two options, either independantly or together. The setting for enabling or disabling the display is located at the bottom of the screen.
You can judge upon the energy condition by the color of the circles, seen there on the backgound of the lines, as well as by the color of each sector, highlighted by the cursor touch. The colors of the sectors are bright, and the colors on the background are pale,but their meaning is the same.
The range between light green and pale pink is a wide corridor of norm, pure green represents a narrow corridor of norm.
Get more information on how to interpret the relative and absolute energy in the article "Update of Organ pulses / Chinese scheme module".
Ayurvedic scheme
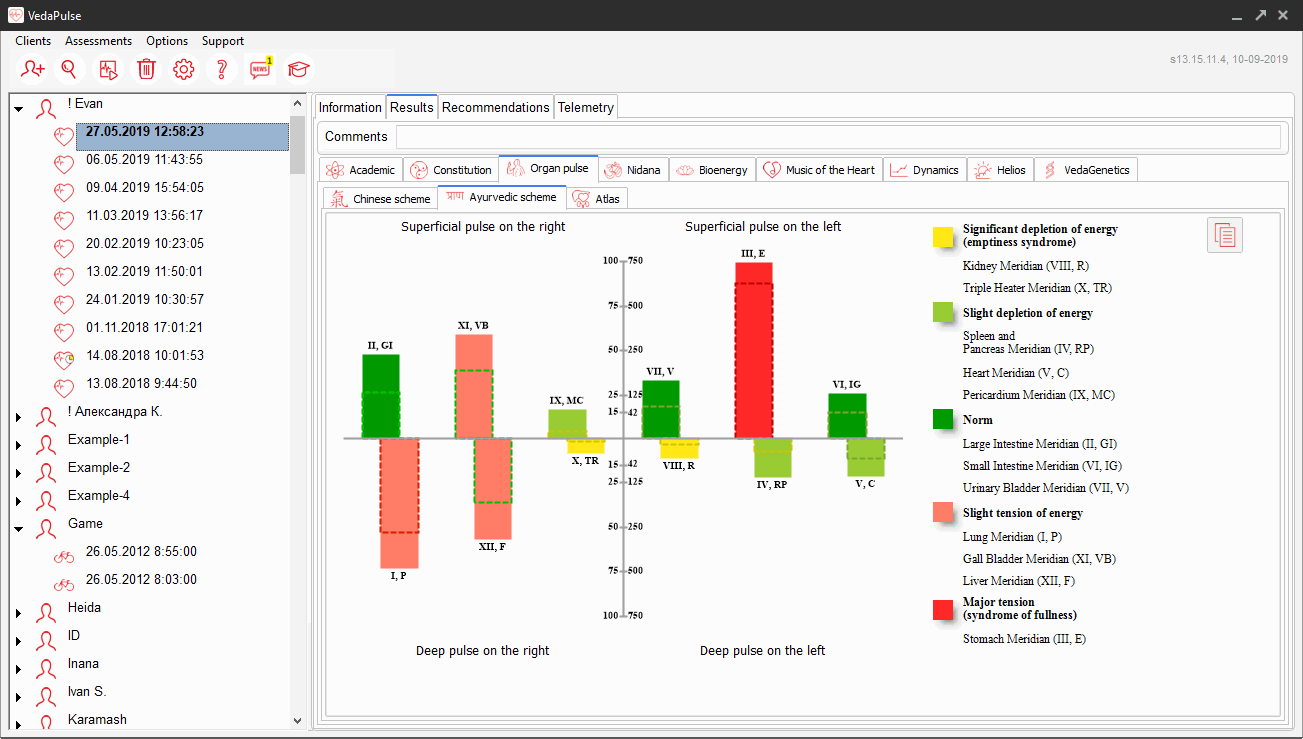
12 vital organs are located in accordance with the points to determine the pulse of the organs on the hands,
observing the deep and superficial pulse.
In different schools of traditional medicine there are different arrangements of points to determine the pulse
of the bodies. The program uses the scheme of Dr. Vasant Lad, the author of "Diagnosis by the pulse."
On both diagrams (Chinese and Ayurvedic): red stands stress syndrome (completeness), and yellow – the energy depletion syndrome (void); orange – light tension, yellow-green – slight depletion; green indicates the area of standards.
Pay attention! “Organ pulse/Chinese scheme” module was updated recently.
1. Now the distribution of energy through meridians is shown as a flexible line;
2. Text description of every channel was added;
3. The energy of meridians is shown in two graphs: of relative and absolute values of energy;
4. Paid subscription to the module was introduced.
Organ pulse/Chinese scheme
Detailed explanation of all changes and benefits of the new interface is presented in the article Update of “Organ pulse/Chinese scheme”
module.
Atlas
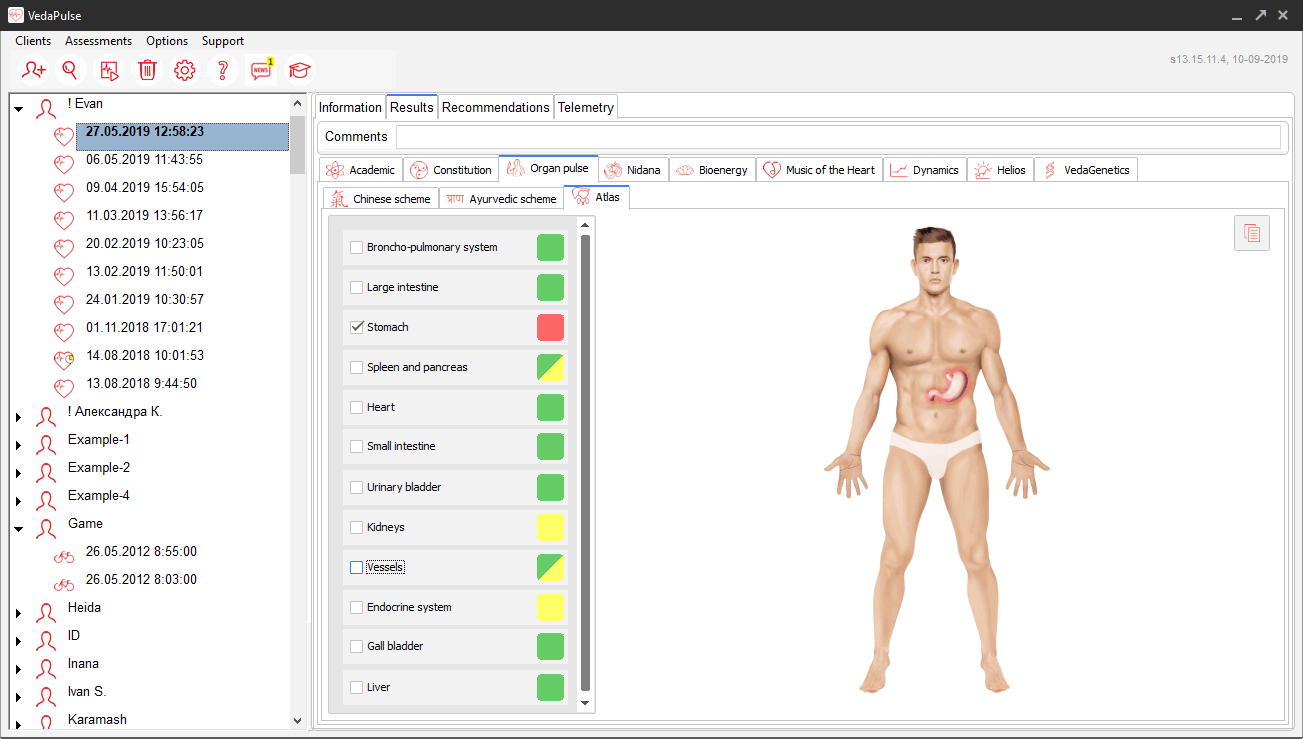
This tab duplicates the information displayed on the chart "Meridians", but it is presented not as graphs, but as a scheme of arrangement of organs and systems in the human body. This diagram shows the current disorders in the mechanisms of regulation in a particular system or a particular organ. Around organs there is a pulsing glow that shows the state of energy in the body. Yellow marks the lack of energy (risk zone), red — excess (tension), and green marks the normal level of energy. The zone of slight exhaustion and tension, used in the "Meridians", are summarized in the standards in the "Atlas" tab. The Atlas is useful for demonstration to patients their functional status, and for professionals it is recommended to work with the tab "Meridians".
Nidana
The Nidana is designed for experts in Ayurveda. the
Nidana (SKT. Nidānam) – in a broad sense, the root cause of something; in Ayurveda-sastra – the cause of the
disease, or the doctrine of causation (etiology).
Nidana contains three tabs: Subdosha, Dhatu, Pancha-Maha-Bhuta.
Subdosha
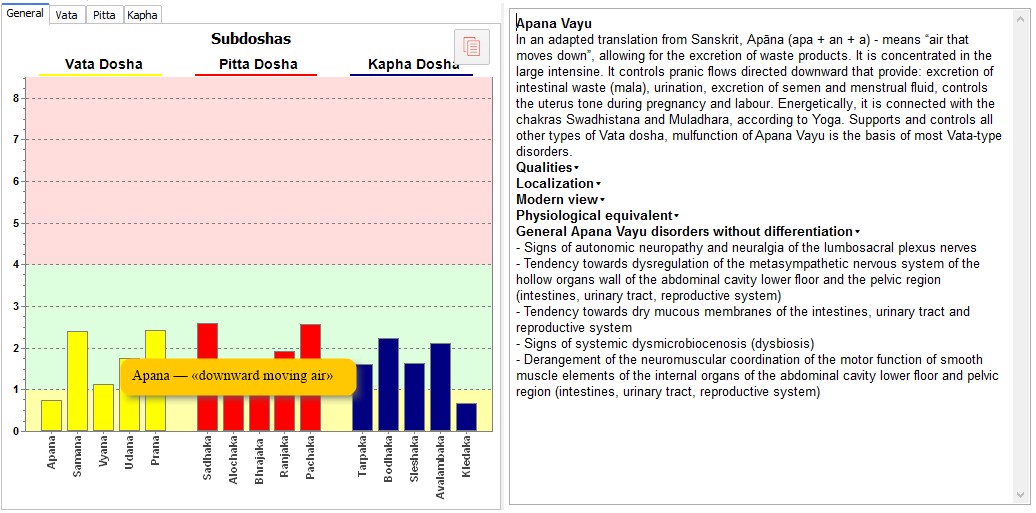
Subdosha — the analysis of the subtle components of Dosha (5 types of Prana, 5 types of Fire, 5 types of Mucus).
Subdoshas are represented by the bar chart, as well as by a sector diagram, representing Subdosha projection on the corresponding fingers during palpation.

When clicking on the bar / sector in the right part of the screen you'd get a detailed textual description for each regulation system or Subdosha.
The detailed description is provided for each Subdosha within the following parameters:
Name, etymology, general description
Properties (or Gunas)
Localization – the area of origination and concentration of Subdosha in the body, its pathways
of spreading
Modern view – what biophysical mechanisms and physiological processes stand for each
Subdosha.
Physiological equivalent – is a complete analysis from the perspectives of clinical medicine,
Ayurveda and TCM physiology, features of metabolism and common symptoms typical for the imbalance of each
Subdosha.
Read more in articles:
Dhatu (tissue)
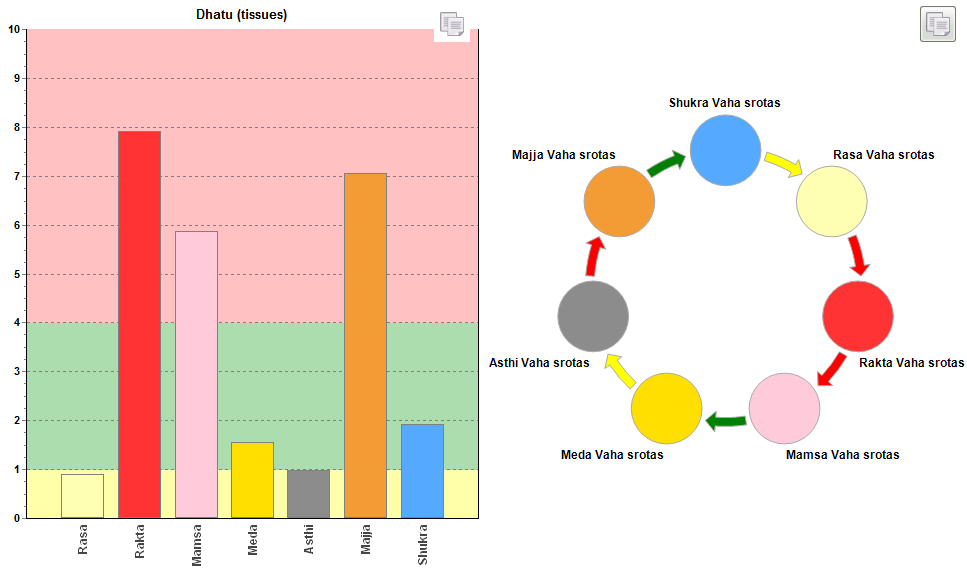
Dhatu – energy-metabolic state of the tissues and the srotas (channels of tissues'
nutrition).
For more details, read the article:
Pancha-Maha-Bhuta (basic elements)
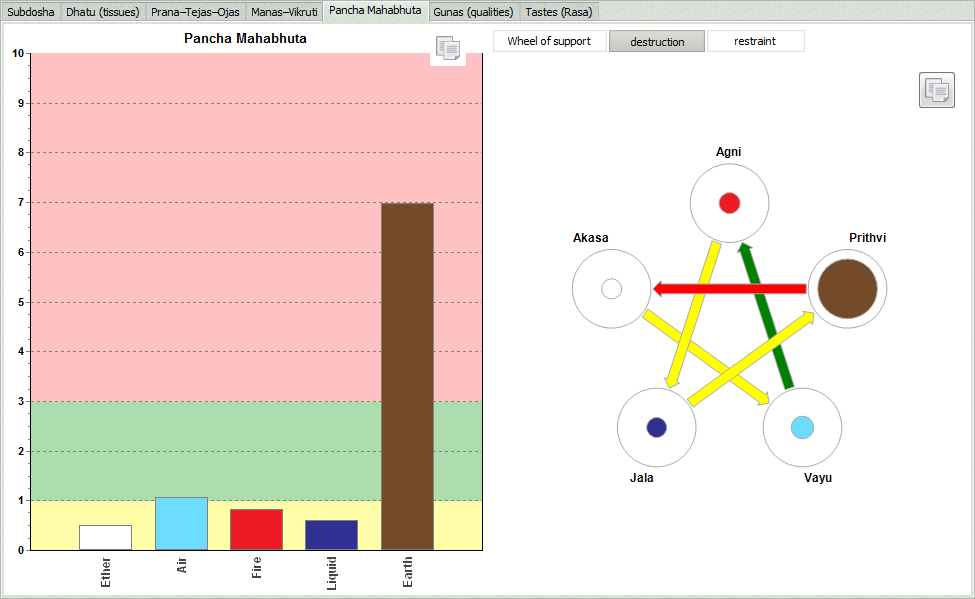
Pancha-Maha-Bhuta – assessment of the status of the elements (ether, air, fire, water, earth)
and their relationship (the wheel support and destruction) as an equivalent of regulation mechanisms.
For more details, read the article:
Bioenergy
Bioenergy designed for a wide range of experts using Eastern practices. Includes two tabs: Chakras, Bioenergy field.
Chakras
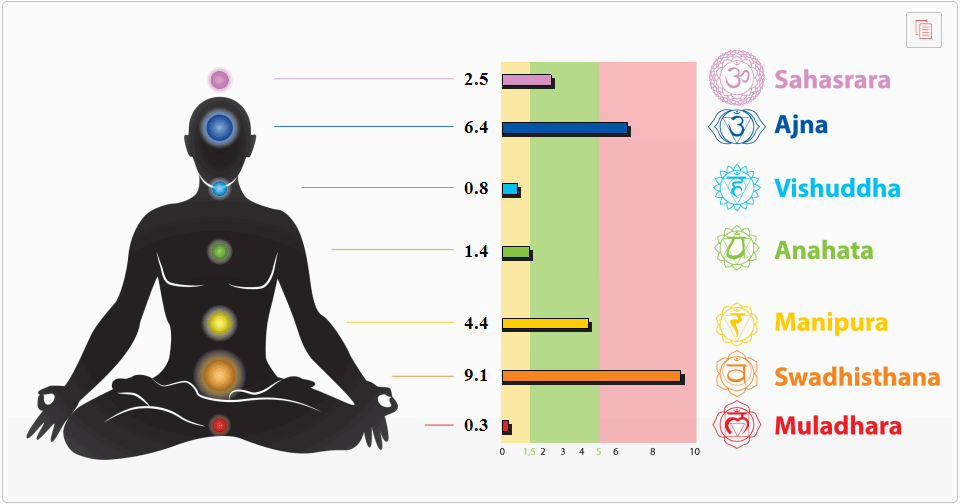
The schematic figure of a yogi shows the seven chakras:
Muladhara, Svadhisthana, Manipura, Anahata, Vishuddha, Ajna, Sahasrara.
The energy of the chakras is represented by a diameter of the circle of chakra in the body of a yogi and
presented in the table on the right on the screen.
0-1,5 points — the lack of energy
1,5–5 points — norm
5-10 points — tension
Energy field
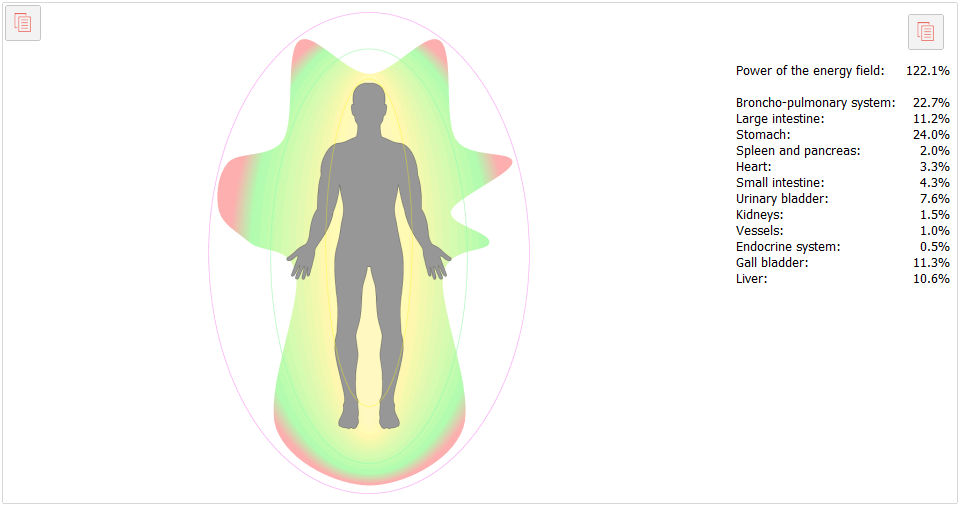
The program draws the field structure around a full-length figure of a man in schematic form. The size of this
field shows resources of adaptation. Failures in the configuration of the field illustrate the lack of
functional resources in one of the systems of the body. For clarity, they are highlighted in yellow.
Green represents areas associated with the functional state of organs with sufficient resources.
Accordingly, the parts of the field, beyond the boundaries of the norm, denote the systems of the body with a
highly mobilized resources. They are highlighted in red.
When you put the cursor to any area of the field, a window with the name of the functional systems of the body
pops up.
Additionally the power of the energy field in general and the share of each of the systems are calculated.
Power of energy field is greater than 100% indicates increased resources of adaptation.
This tab allows to assess the overall condition of resources of the adaptation, and its local distribution between systems of the body. With this tab, it is convenient to study the dynamics of the functional state of the organism after any impact. Also, it is possible to see the whole process of body recovery, if one conducts regular assessments during rehabilitation, and then sequentially scrolls through all these tests.
Music of the heart
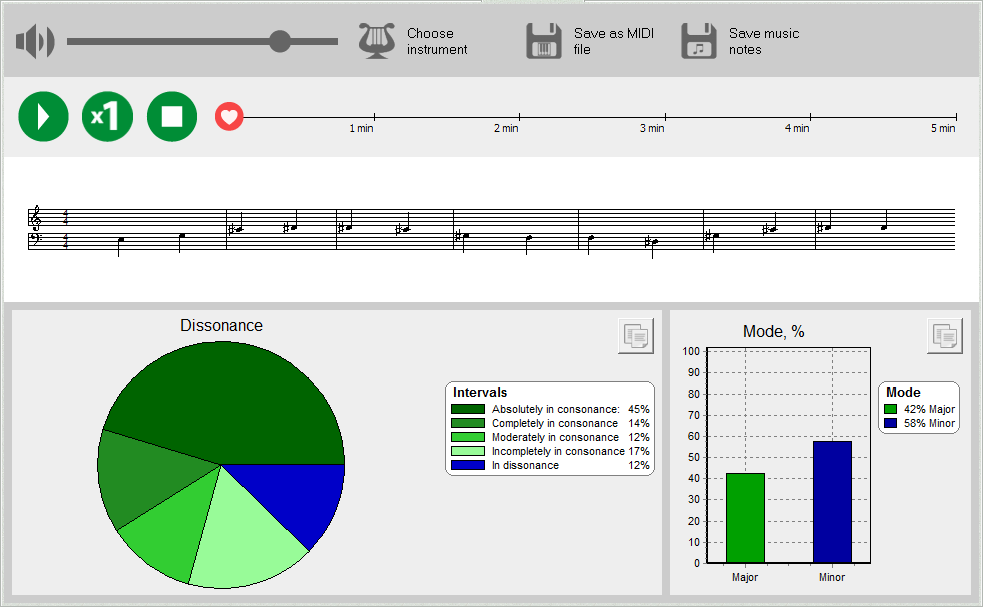
Designed to transform the recording of the heart rhythm in a piece of music that you can listen, save as an audio file or in the form of notes. One can use musical analysis here: to determine the percentage of consonant and dissonant harmonies, and a ratio of major and minor tonalities in the melody of the heart.
The fact that the laws of musical harmony and the laws of human health are United, has been known since ancient times (the Gandharva Vidya in Ayurveda, the doctrine of the Harmony of the spheres of Pythagoras and Aristotle in antiquity). This idea dates back to global philosophical principle — to the idea of the unity of the laws of the universe. So, the application of mathematical laws of musical harmony to assess heart rhythm looks quite naturally.
Dynamics
The module «Dynamics» has two modes and allows to track the changes of the parameters in time:
- changes in all the diagnostic parameters from one test to another;
- dynamic changes of four parameters during the test.
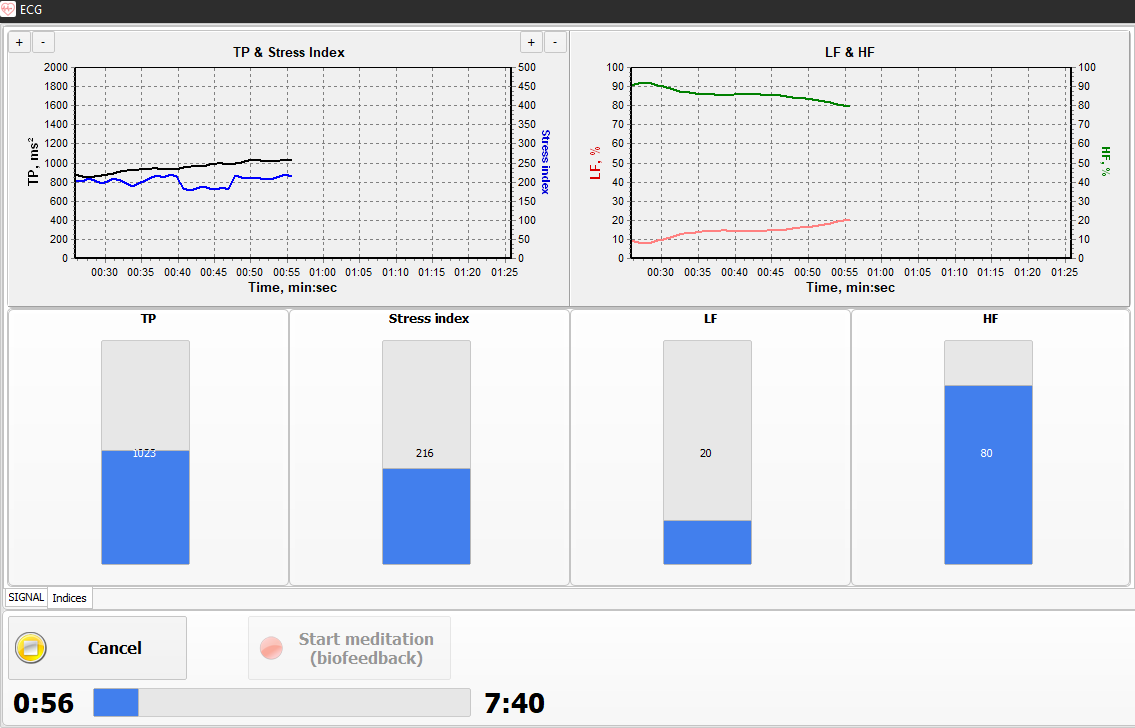
Online Dynamics
At the stage of recording ECG in the monitoring window (ECG) switch from the tab «Signal» to the tab «Indices» (1). Online Dynamics assesses the changes in the Total Power parameter, stress index, LF and HF in the form of graphs and bars. You can scale the axes of the graph «TP and stress index» by pressing the buttons «+» and «-» (2, 3).
Offline Dynamics
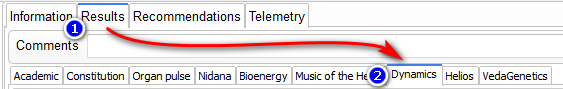
Open the patient's card. Choose the examination tab. Choose section “Results of the test” (1). Click on the «Dynamics» tab (2).
“Dynamics” tab includes 4 methods of correlation of different representations of the tests.
- linear graphs;
- bar charts;
- tables;
- user profiles.
Before analyzing the dynamics of the test, in the list of tests choose those recordings which are be presented in the graphs.
To carry out the analysis of tests' dynamics, choose the recordings which will be presented in graphs from the list of recordings.
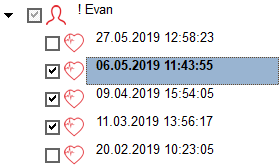
The graphs are generated basing on two or more tests.
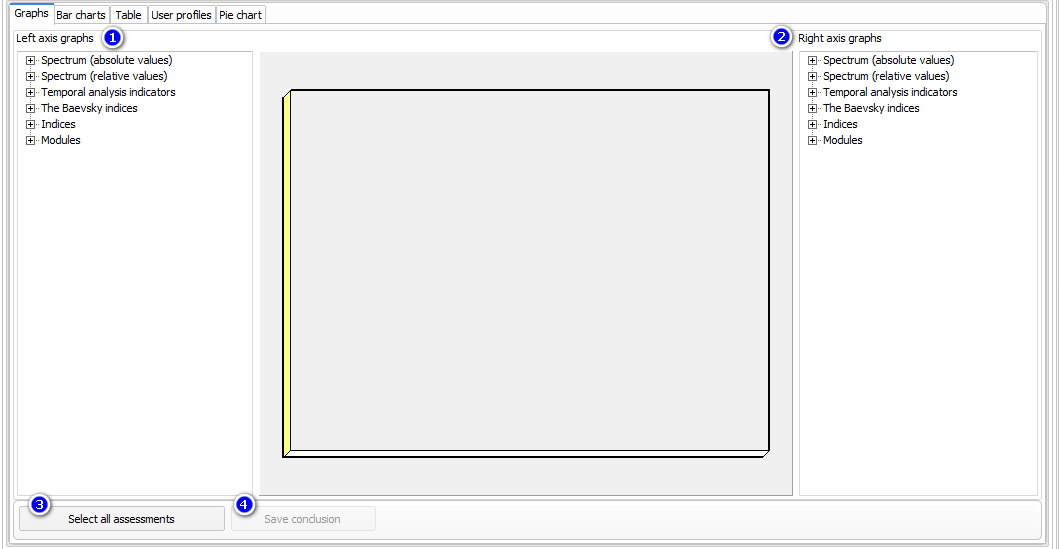
From the lists (1) and (2) choose parameters needed to generate the graphs. Graphs are generated automatically. You can use the button "Select all tests" (3). Save the graphs using the button "Save the report" (4).
In case the parameter’s name is not fully visible, hover it and the full name of the parameter will appear.
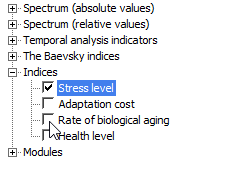
You can zoom any area of the graph by the selection click from left to right (see 1 in the image below).
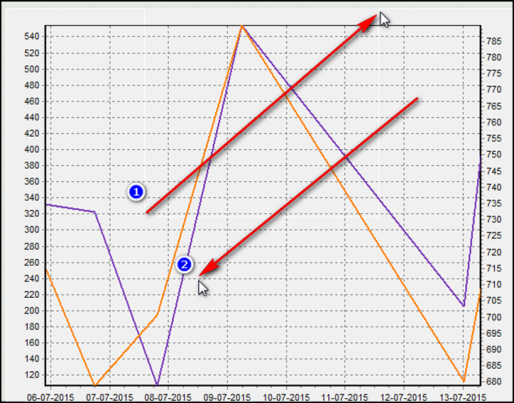
A reverse selection (from right to left) (2) will bring all the graphs back to the full size. You can also use the option of shifting along the graph: hold the right mouse button at any spot in the graph and shift the image.
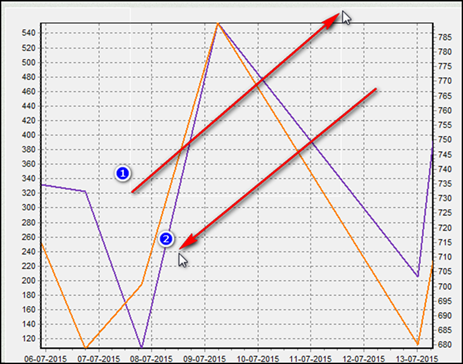
Besides, to be more convenient for reading the graphs the “Dynamics” tab includes two options: transmission of the scale of the graph to another axis and changing of the color of the graph. To use this option, choose the parameter by clicking on it with the left mouse button. Then click on it again but with the right mouse button.
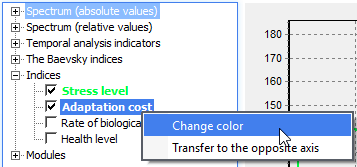
The «Bar charts» tab allows to compare tests based on the parameters from the modules.
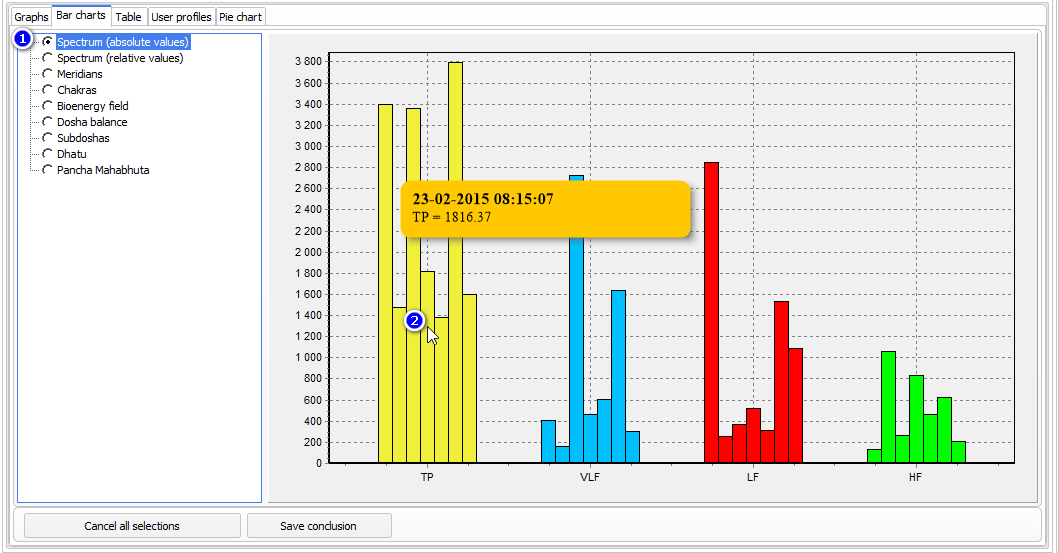
Select a group of the needed parameters (1). Then click on the bar (2) to know the quantity, the date and when it was registered.
If graphs allow you to compare the indices only visually, the table enables us to compare them numerically. Color spectrum from the "Index" tab remains the same on the background of the corresponding cell.
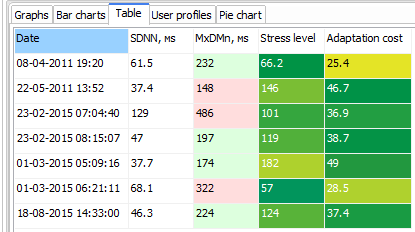
You can export the data into Excel table using the corresponding button in the "Tables" tab.
The "User profiles" tab allows You to create specific tables – profiles – to add different parameters to the existing indicators of “VedaPulse”.
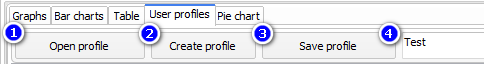
The following options are available for the profiles: download the profile that is already formed (1), create a new profile (2), save the generated profile (3), naming / renaming the profile (4). To create a new profile select the records in the list of the tests which are to be included in the graphics. Then click "Create a profile".
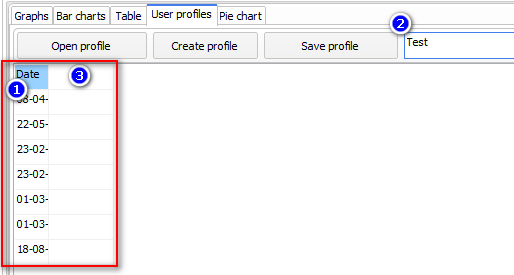
After that a table with the tests will appear. (1). Fill in the field «Profile’s name» (2). Click twice on the blue cell of the header of the table. Type your parameter. (3).
Then a creation of the additional column on the right will follow. Here you can type the next parameter. Fill the table and click “Save the profile”.
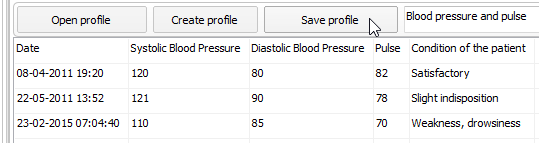
Go to the "Graphs" tab. At the bottom of the list of the parameters the newly created profile will appear. Opening it, You will see the parameters with the numbers set in the columns. The graphs will be arranged in accordance with the numbers.
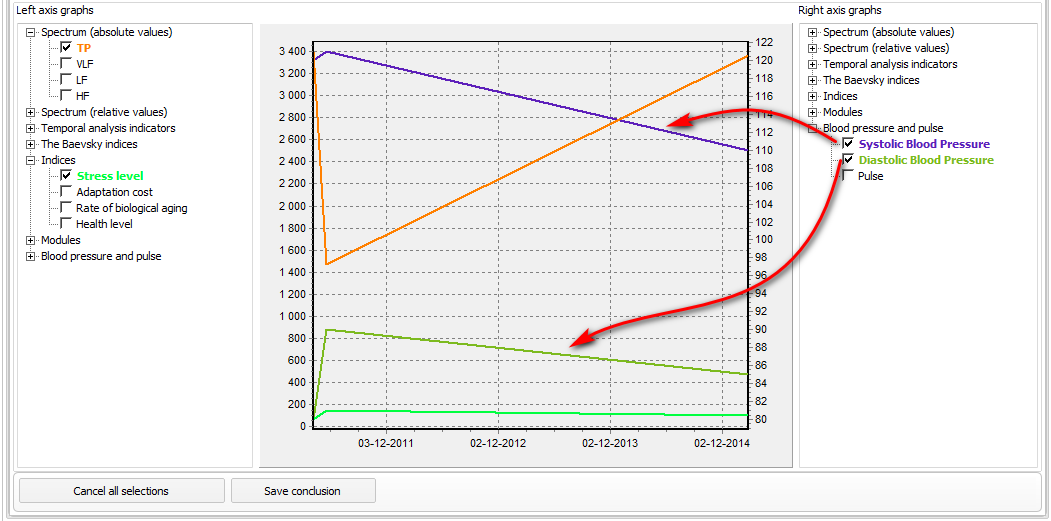
If you need to add more tests, remember that it will take insertion of the numerical data into a new line in the "User profiles" tab. Graphs are built only for a fully filled parameters’ setting.
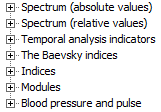
The "Save the report" option in any of the tabs - "Graphs", "Bar charts", "Tables" - allows us to save all of the graphic data of all these sections in the Word file (rtf).
After pressing the button "Save the report" there appears a window containing all of the given graphs. There is a standard set of options for the text files in the window:
- save charts to the rtf-file (Word);
- copy the selected fragment to the clipboard;
- paste from the clipboard;
- print.
VedaGenetics
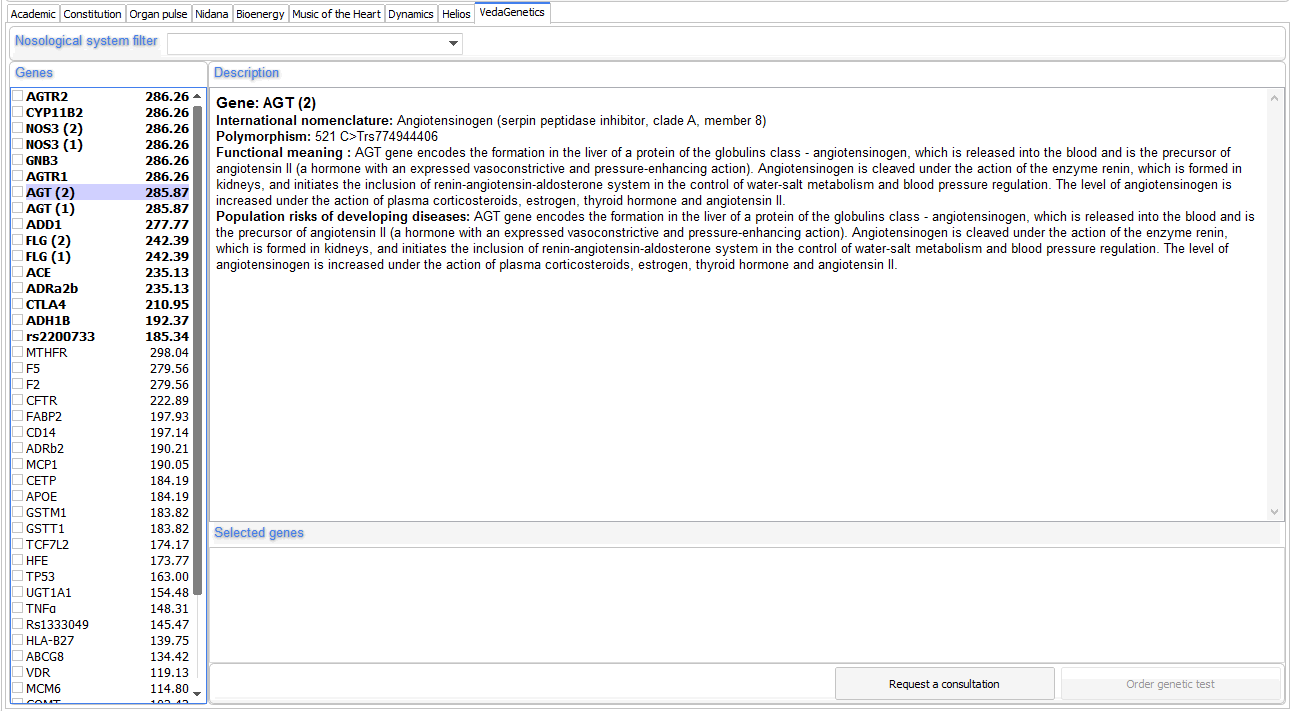
The module “VedaGenetics” allows specialists of traditional medicine to select genes for a bench testing, based on the analysis of doshas, subdoshas, state of dhatu (tissues) and channel energy (the module “Organs’ pulse”).
The module “VedaGenetics” is oriented to specialists of traditional medicine, practitioners of Ayurveda, TCM, herbal therapy, dietology, naturopathy and other traditional approaches of healing who wish to expand their diagnostic capabilities using modern methods.
The program generates the list of genes automatically and it is based on the fact that it is more likely that person of this constitution type has a high possibility of polymorphism (changes) in these genes.
You should press on a gene from the list to see its description. You can form the list of genes, ticking their names. Based on the list you can “Request a consultation” or “Order genetic test” accordingly.
Tongue diagnosis
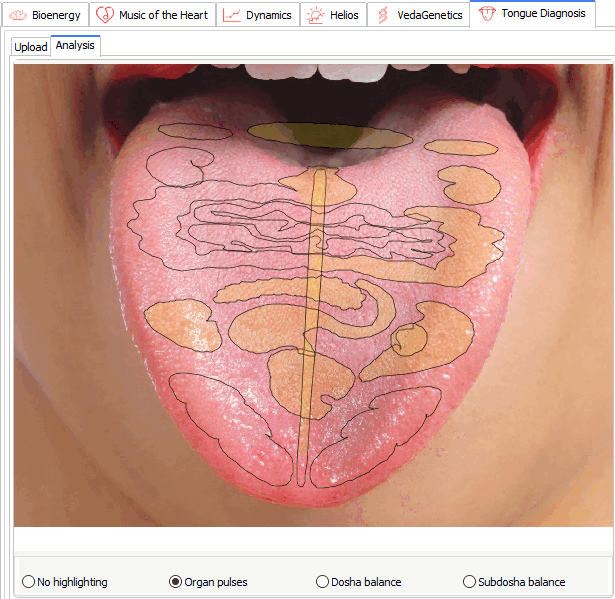
To start working with the module you need to get a new assessment done. Once the recording is completed, open the assessment card (Results - Tongue diagnosis). The module "Tongue diagnosis" consists of 2 tabs - Upload and Analysis.
Upload tab is designed for photo-registering of the patient's tongue and defining the borders of the tongue for the analysis. In the tab you can chose and click "Select image" to open the window suggesting different ways for uploading the photo: you can upload the photo right from your computer - "Upload from file"
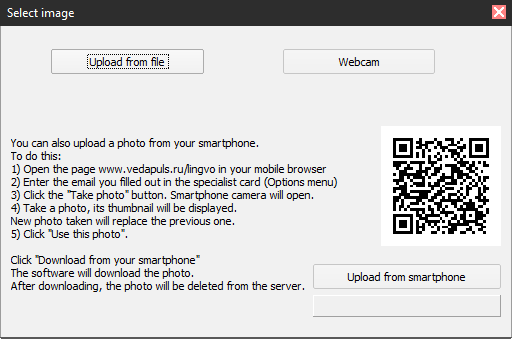
Or you can take a snapshot from a webcam on your laptop or the outside USB webcam. Select "Webcam" and you'd see "Take photo" window open, where you can chose camera (out of the available ones), resolution (it is recommended to use the highes resolution possible), or fix the camera settings. To take a picture of the tongue click "Take a snapshot".
You can also upload the photo from your smartphone.
Click "Upload from smartphone" and the program would start serching the photo for uploading.
1) In the browser of your smartphone upload the webpage vedapuls.ru/lingvo (by inserting the link manually or by using QR code)2) Once you get the webpage open, insert your e-mail (the one that you have in the specialist's card). In case of using QR code, you get your e-mail inserted automatically.
3) Click "Take photo" to get the camera open.
4) Take a photo. You'd get a thumbnail photo displayed on your smarthone. The newer photo always replaces the previous one.
5) Click "Send". The photo gets deleted from the webserver the moment it gets uploaded on your computer.
After you get the photo uploaded you need to define the borders of the tongue in the image for the analysis by outlining the tongue rims with the dashed border lines . Use the green regulation dot (to define the side and the upper borders), the pink regulation dot (for lower borders) and the purple dot (to define the width of the tongue tip), fixate the dashed border line on the rims of the tongue. If needed, click Rotate (each click rotates the image by 90 degrees).
Analysis - an automized algorithm developed for analysing the pathological stigmas of the body projected in the different zones of the tongue. The algorithm automatically puts the projections of body functional systems onto the tongue image. After that the specialist carries out the analysys of the pathological stigmas projected in the different zones of the tongue.
The program highlights in red and yellow the zones, that the specialist should pay the utmost attention to, taking into account the data on the current functional state of the body, provided by the ECG-recording (the specialist can choose different levels for the assessment - Organ pulses, Doshas, Subdoshas).
In the text field the specialist describes the patient's condition based on visual analysis, puts his reports and recommendations.
Detailed information about the module
Iridology
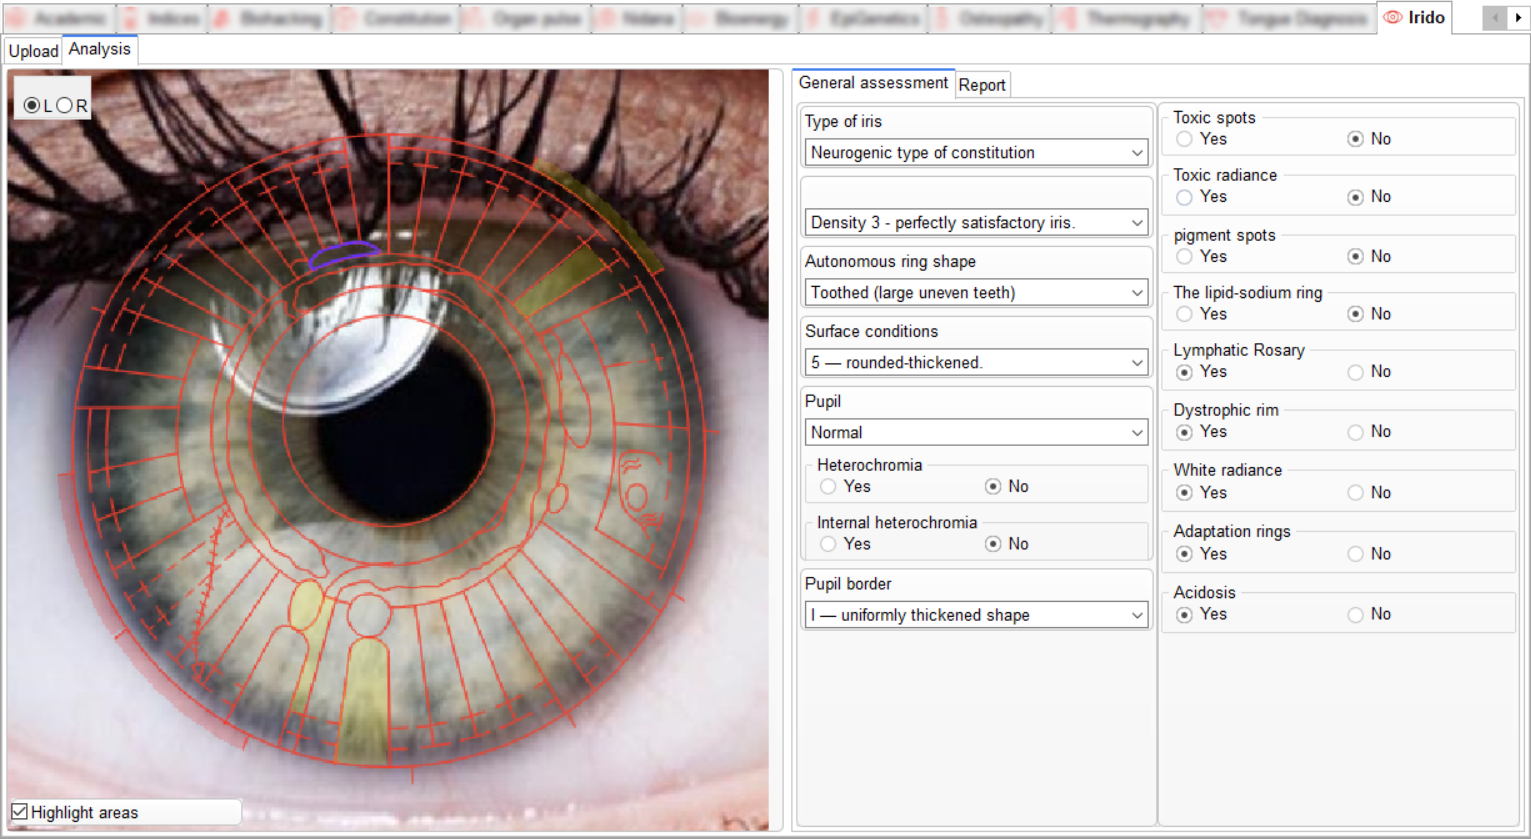
The Iridology software module allows you to identify the connection between the unique signs of the iris of the eye and diseases of internal organs, helping to determine the correct therapy protocol.
The module consists of 2 sub-tabs: Upload and Analysis.
The Upload sub-tab is designed for photoregistration of the patient's irises and determining the boundaries of the area for assessment.
Upload the images of the left and right eyes separately using the Select image buttons located on the left and right sides.
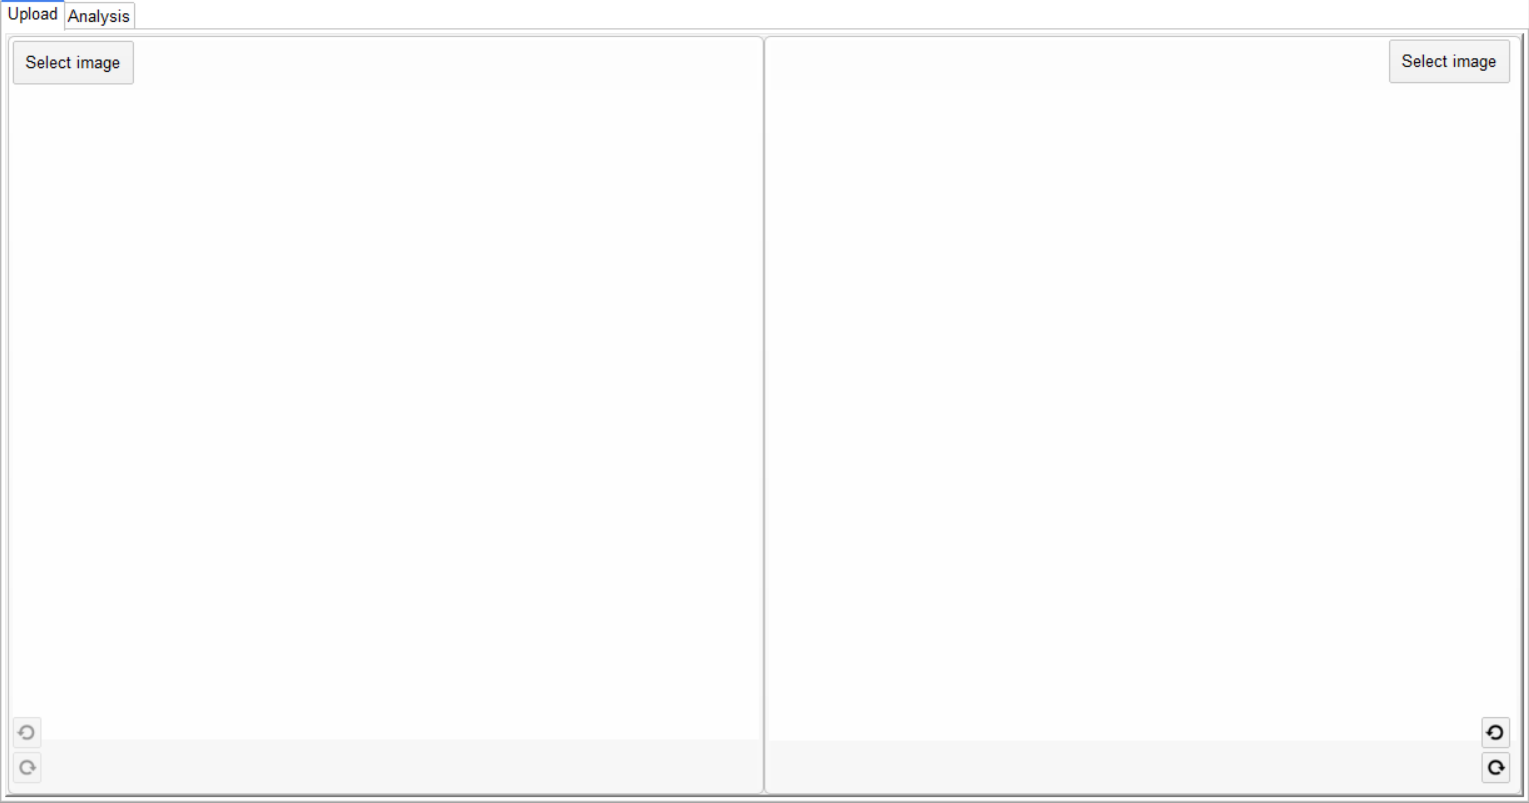
A window will open asking you to upload an image of the eye in one of three ways: download from a file saved on your computer, take a picture of the eye using a webcam, or upload a photo from your smartphone.
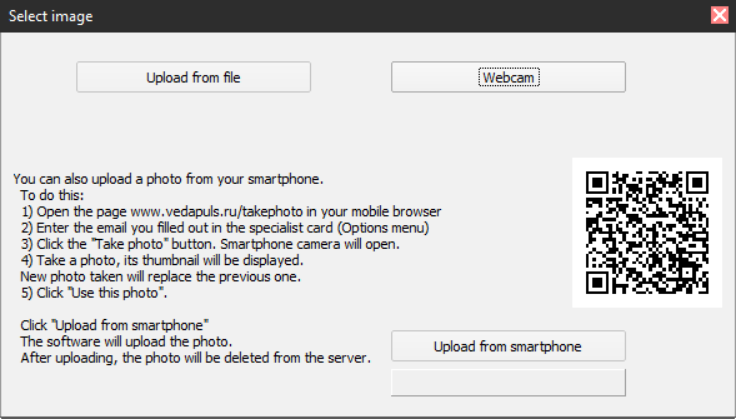
To download a photo from your computer, click Upload from file.
Or you can take a snapshot from a webcam on your laptop or the outside USB webcam. Select Webcam and you'd see Take a photo window open, where you can choose camera (out of the available ones), resolution (it is recommended to use the highest resolution possible), or fix the camera settings. To take a picture of the eye click Capture.
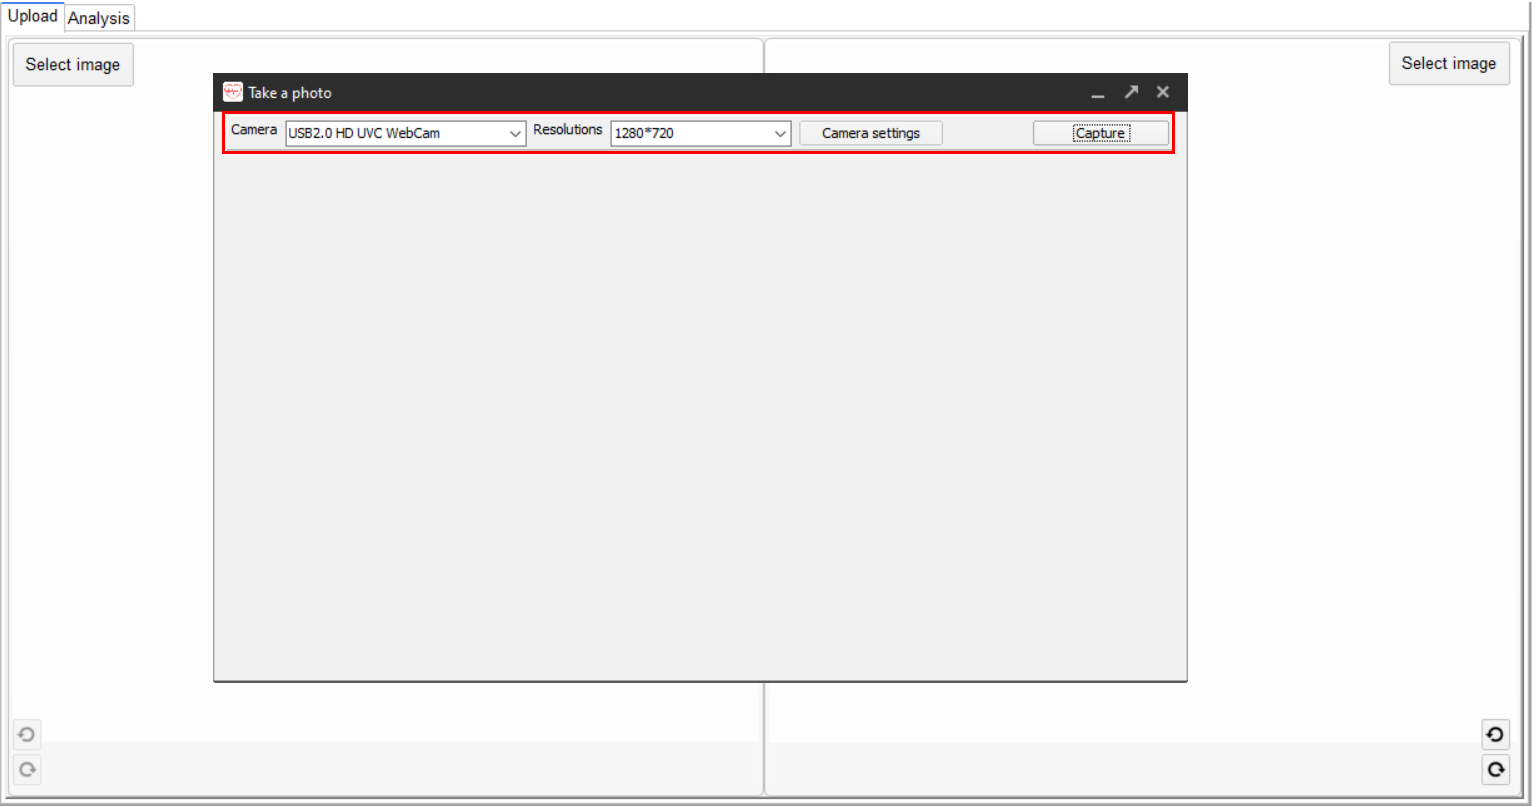
You can also upload the photo from your smartphone:
1) In the browser of your smartphone upload the webpage vedapuls.ru/takephoto (by inserting the link manually or by using QR code);
2) Once you get the webpage open, insert your e-mail (the one that you have in the Specialist's profile). In case of using QR code, you get your e-mail inserted automatically;
3) Click Take a photo to get the camera open;
4) Take a photo of the eye. You'd get a thumbnail photo displayed on your smarthone;
5) Click Use this photo. The newer photo always replaces the previous one. Wait until the Photo loaded successfully status appears.
- Click Upload from smartphone in the VedaPulse Professional program. The photo will be uploaded.
Note: Once uploaded, the photo will be deleted from the server and stored only on your computer.
After uploading a photo of the left and right eyes, manually adjust the position of the labels to highlight the
pupil and iris. Use green dots to highlight the iris and blue dots to highlight the pupil. If necessary, use the
icons
 to rotate the image (each click rotates the image by 90 degrees).
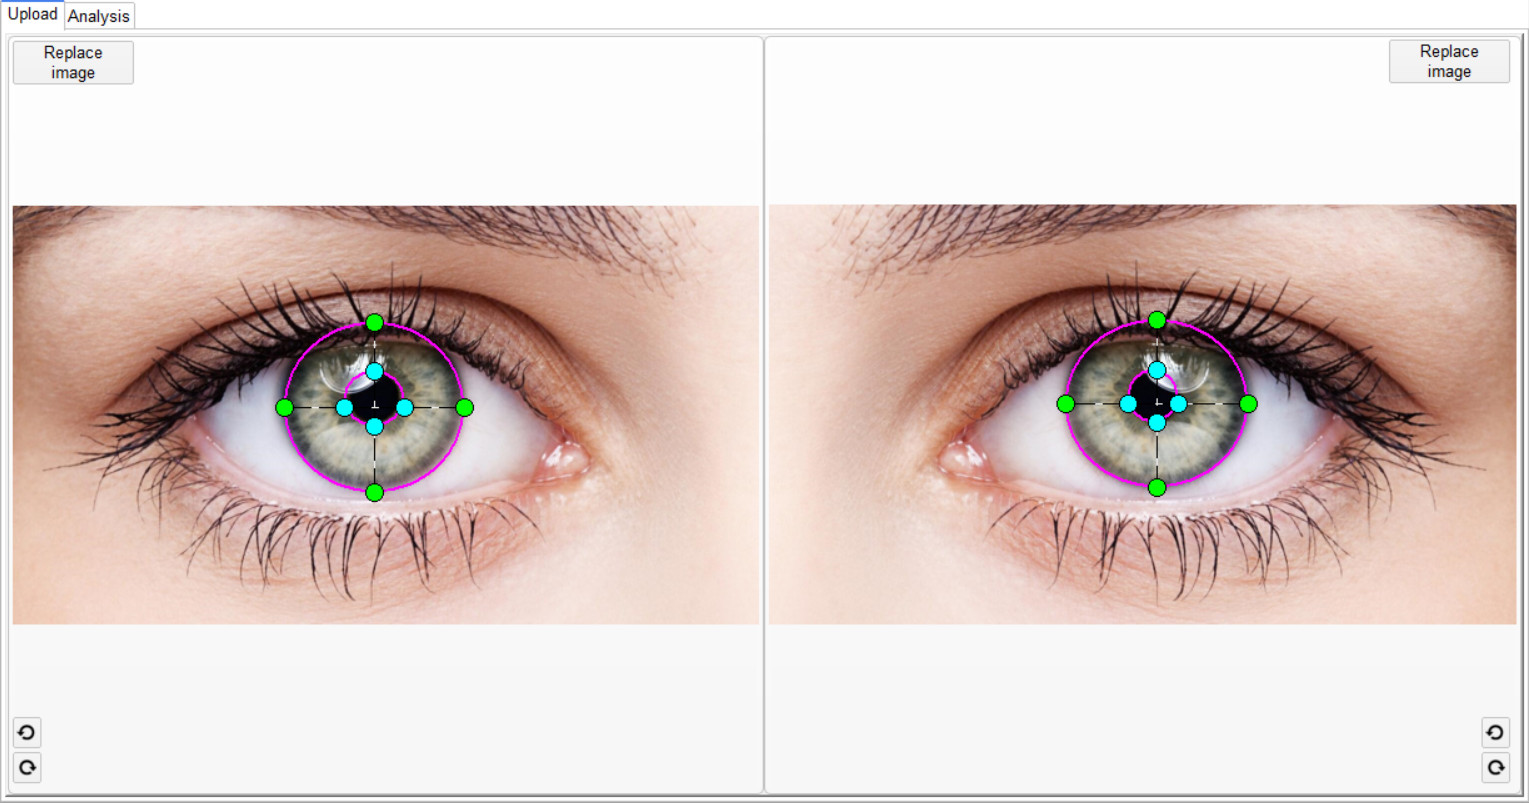
Note: You can take photos of the iris with a smartphone camera if it has a macro mode. It is also recommended to use special iridoscopic cameras or macro attachments on the smartphone camera. Diagnostic capabilities depend heavily on the quality of the image. Use high-sensitivity cameras with good resolution and high-quality optics.
The Analysis sub-tab displays an image of the iris with an interactive map of the projection zones applied to it, a general assessment block and a report.
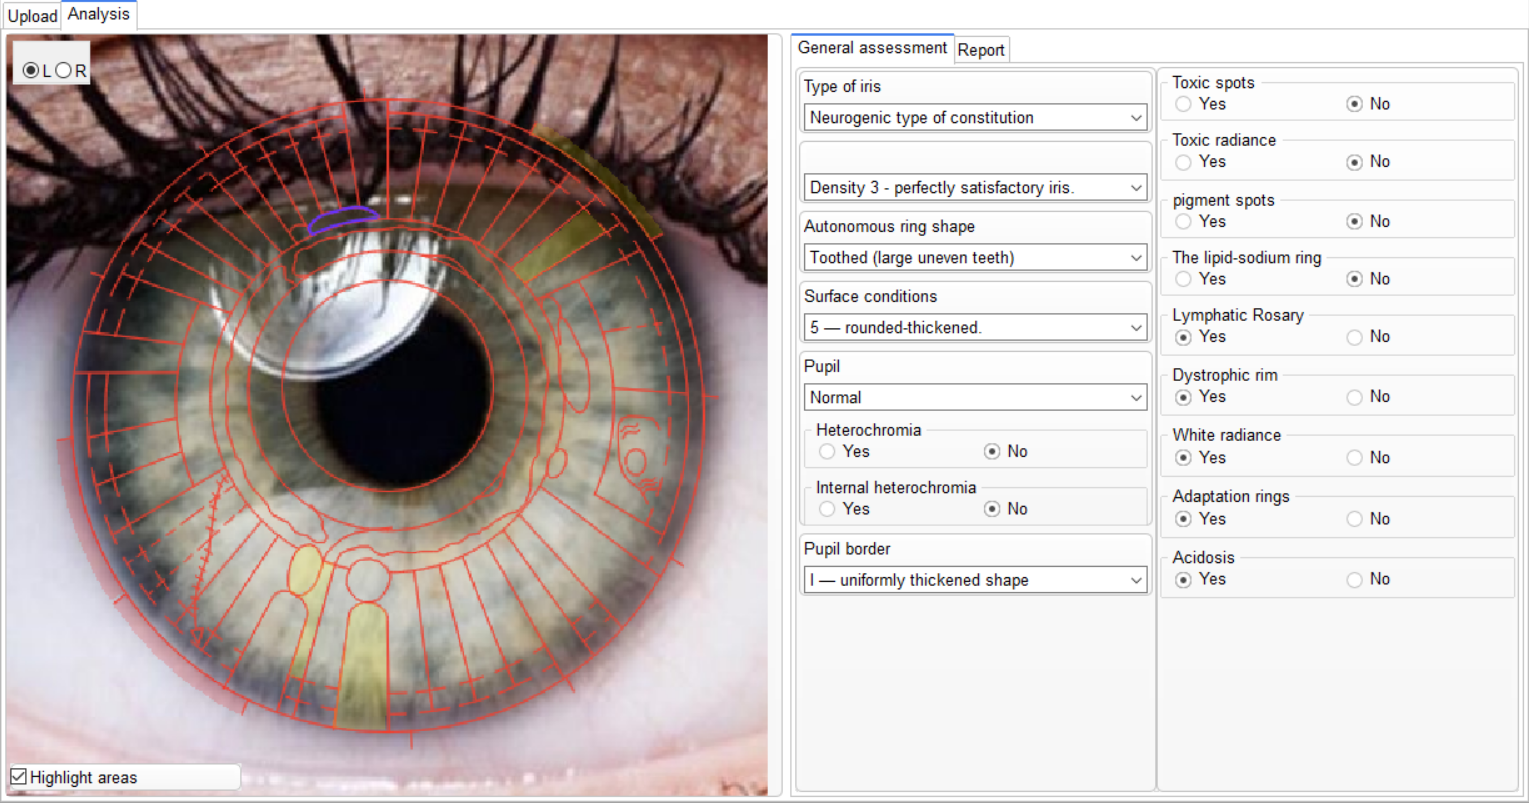
The image of the iris of the eye (right or left, depending on the L/R switch) has a map of projection zones: according to E.S. Velhover and according to B. Jensen. To select a map, go to Options – Settings – Module settings – The Iridodiagnostic software module in the main menu of the program.
The program highlights the areas on the iris that you need to pay attention to, based on the analysis of the heart rate. You can disable zone highlighting by unchecking the Highlight areas check box in the lower left corner.
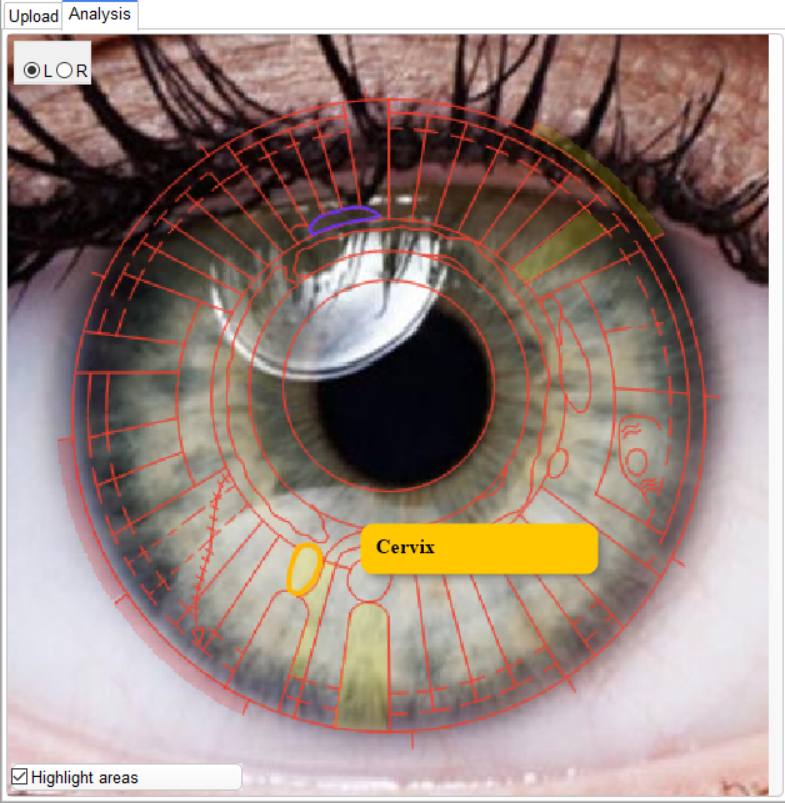
When clicking on the projection area, a menu is displayed – a list of possible morphological changes in the iris (lacunae of various types, vessels, rays, rings, etc., with pop-up tips). When selecting any item, a description of a possible pathological condition will be added to the report.
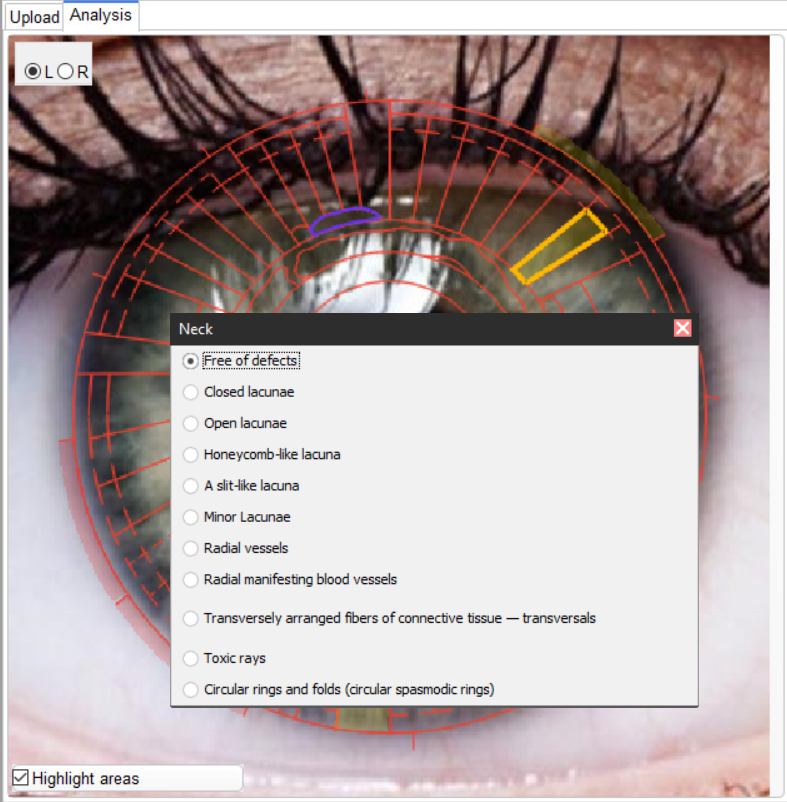
Two sub-tabs are displayed on the right: General assessment and Report
The General assessment sub-tab contains a questionnaire that allows to select the type, density of the iris, shape of the autonomous ring, surface condition, pupil size, presence of heterochromia, type of pupil border, as well as the presence of iridological signs that are characteristic of the iris as a whole and reflect the general human condition: toxic spots, toxic radiance, lipid-sodium ring, lymphatic rosary, dystrophic rim, white radiance, adaptive rings, acidosis. By selecting an item in the questionnaire (it is not necessary to select all items), a description of a possible pathological condition is added to the report.
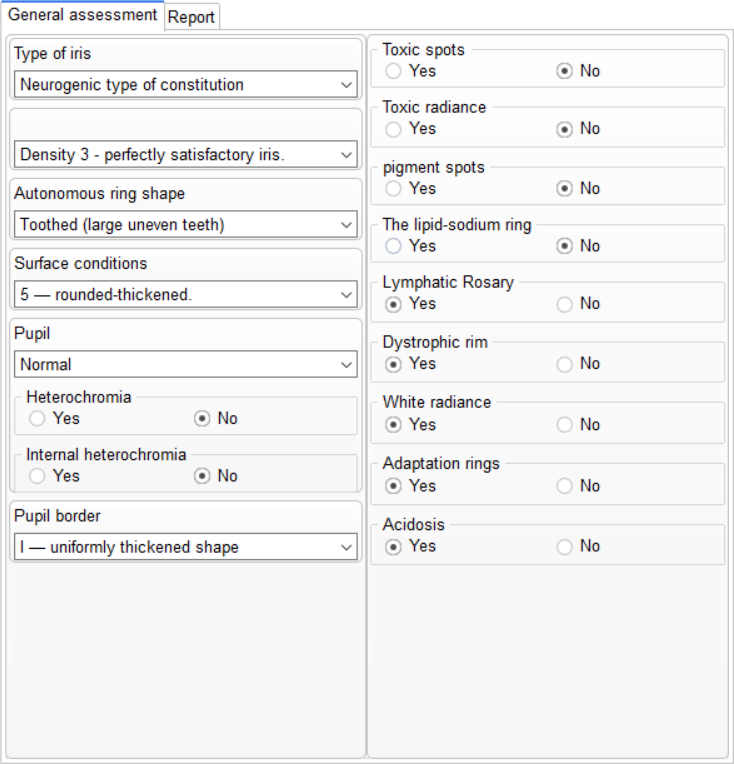
Hovering over any of the items will display tips that briefly describe the artefacts, and more detailed tips are descriptions of the selected states/forms in drop-down lists.
The Report sub-tab will display descriptions of the pupil defects noted by a specialist from the point of view of iridodiagnostic.
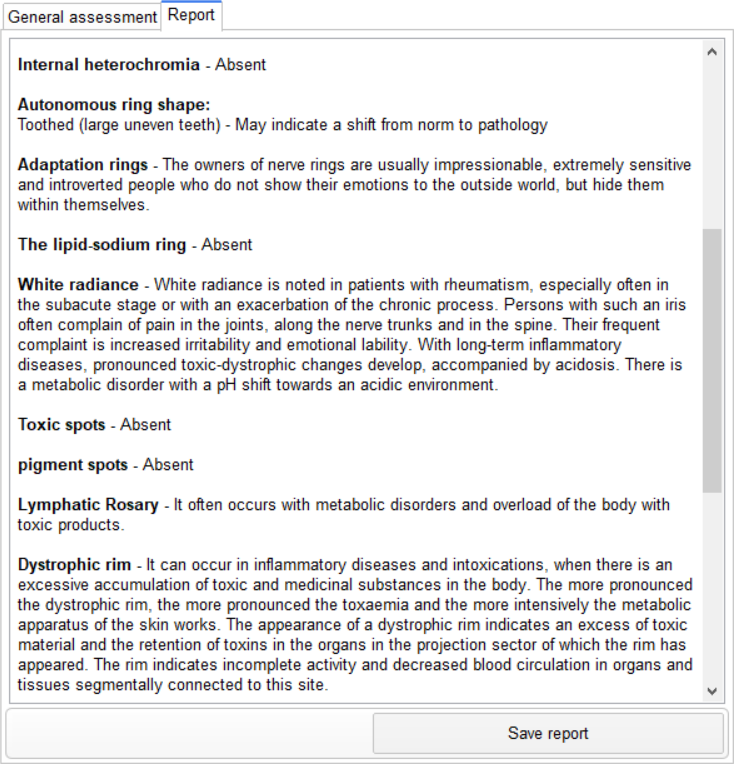
Click the Save Report button to save the information from the module to a separate file.
Osteopathy
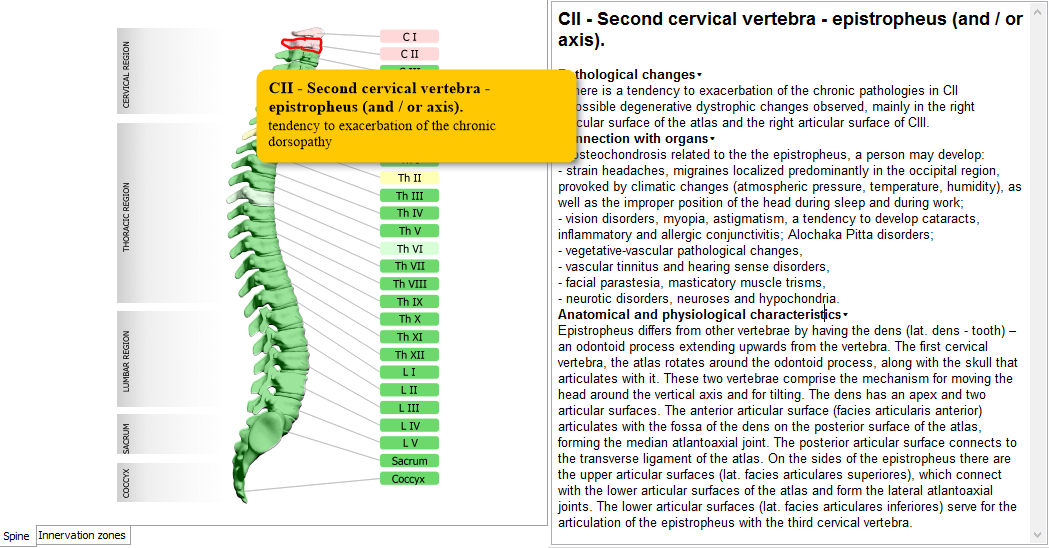
The Osteopathy module detects the functional dorsopathy in a particular vertebra or a group of vertebrae. To start working with the module, run a new assessment and go to the assessment card when the recording is complete (the Results tab - Osteopathy).
The vertebrae get specifically colored depending on the condition:
Hover the cursor over a vertebra or the caption to see the pop-up tooltips containing the name of the vertebra and its functional status. Click over to get a detailed description of the needed vertebra / a group of vertebrae with the similar structure / functional features and also the innervation zone (in the Innervation zones tab).
The description sections:
Innervation zones tab
The tab illustrates the connection of the vertebrae with nerves and plexuses. The image of a person is overlapped with innervation zones painted in one of 4 possible colors, the same as the ones used for coloring the vertebrae, except the one denoting the normal condition – the green color.
Hover the pointer over the zone to see the pop-up tooltips containing the name of the spinal nerve and the functional status of the corresponding vertebra. Click over to get a detailed description of the nerves innervating the selected area and also the corresponding vertebra / a group of vertebrae highlighted in the Spine tab.
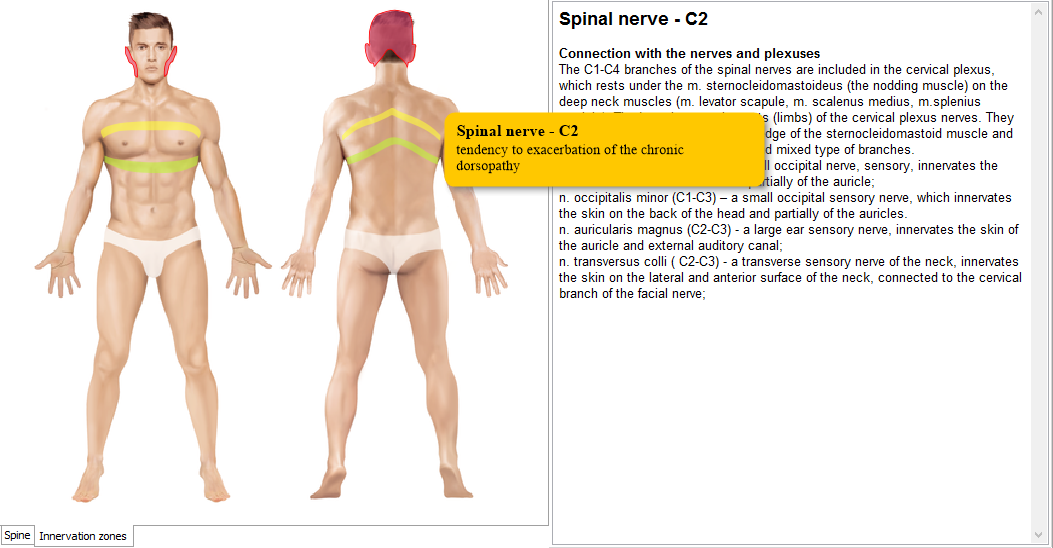
Detailed information about the module
Thermography
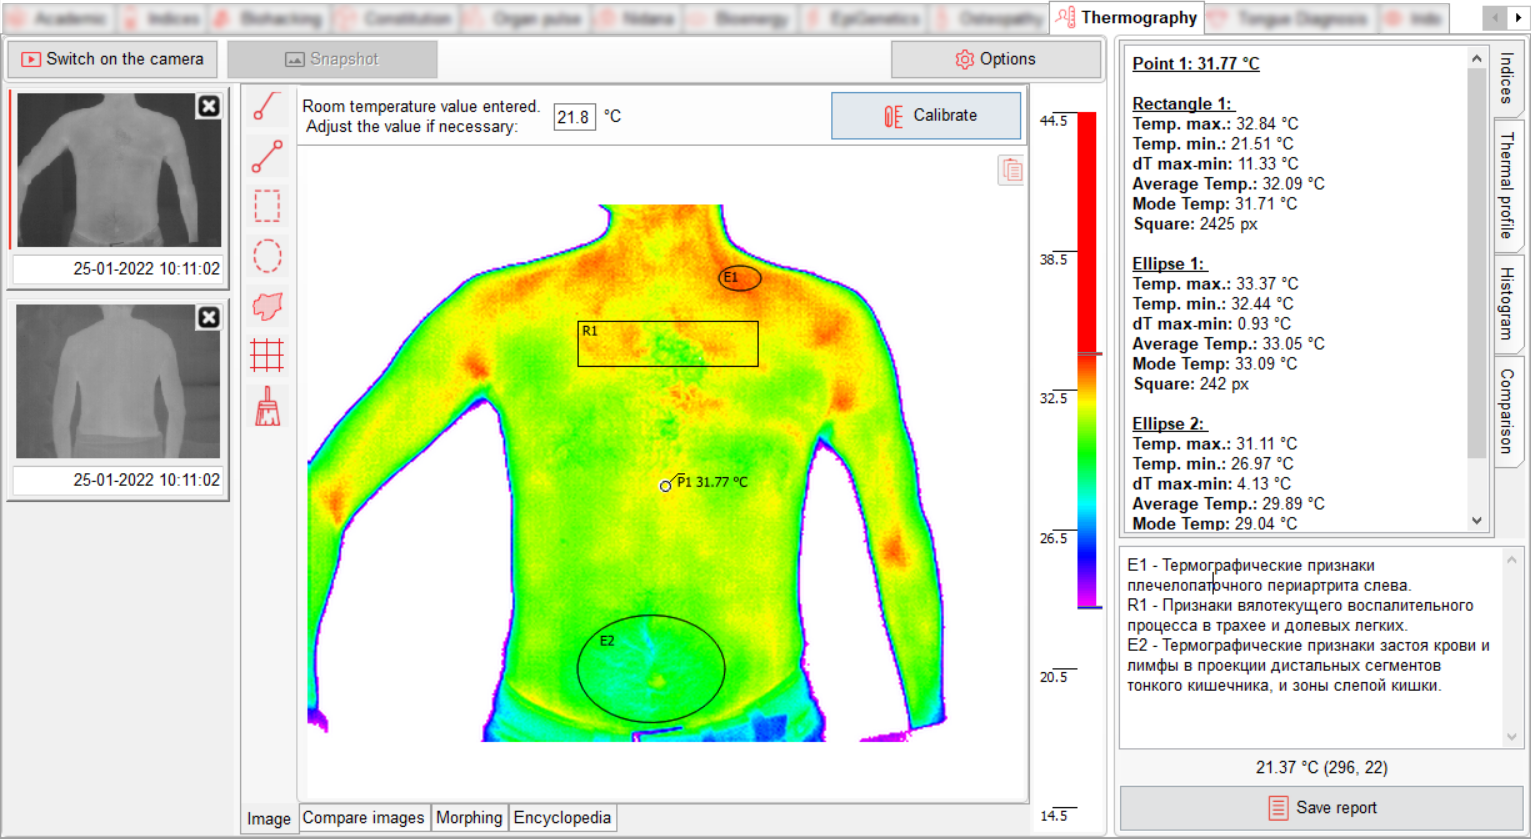
Thermography software module is designed for obtaining images from a thermal imager and analyzing thermograms in combination with ECG recordings.
PC requirements for working with the module:
- Processor – 4-core, frequency – 2500 MHz
- Operating system – Windows 10
- Not less than 4 GB of RAM (not less than 2 GB free RAM)
- Screen resolution not less than 1366x768 pixels
- Video adapter not less than GTX 1050 / RX 560
- One free USB 2.0 port
Shooting room requirements:
- Comfortable room temperature – +23-27°C
- Steady background temperature – no heating devices, mirrors, or metal surfaces in the background
- Distance from the workplace to the subject is from 50 cm to 4 m (for full-length filming)
Delivery set:
- Thermal imager i3system – 1 pc.
- USB-Af cable – USB-Am – 1 pc.
- USB adaptor Type-Cf-USB-Am – 1 pc.
- Thermal imager bracket – 1 pc.
- Tripod – 1 pc.
- Temperature and humidity sensor – 1 pc.
Technical characteristics of the thermal imager:
- Detector type: Mini-Bolometer (uncooled)
- Array format, Pixel pitch: 384x288, 17㎛
- Sensitivity (NETD): < 80mk @F/1.3, 300K
- Wavelength band: 8 ~ 14 µm
- Power supply: USB power
- Power consumption: < 500mW
- Interface: USB-C
- Frame rate: < 9Hz
- Dimensions (W x H x D): 47mm x 25mm x 16mm (Without Lens)
- Weight: < 27g (With Lens)
- Operating temperature: -10°C ~ 50°C
- Scene range temperature: -10°C ~ 150°C
- FOV[º]: 56.3º (H) x 41.8º (V) - 71.4º (diagonal)
To get started with the module, open the assessment, and go to the tab Results – Thermography.
The software module contains a menu for taking snapshots, a gallery of thermograms, a panel for reviewing and analyzing thermograms, a panel for calibrating the temperature regimen, a section for analysis and notes, settings and report window.
To take a snapshot:
- Unpack the set.
- Attach the bracket to the tripod.
- Install tripod on the surface.
- Install thermal imager in the bracket.
- Connect the thermal imager to your PC using USB Type-Cf – USB-Am adapter and USB-Af – USB-Am wire (wires USB Type-Cf – USB-Am) from the set.
- Place the temperature and humidity sensor on the wall behind a subject, within sight of the thermal imager, and wait for the values to be checked.
- Click on the Switch on the camera button in the Thermography module.
- When you use the camera for the first time, the driver installation program will be launched. Install the driver by following the instructions of the installer.
- The module will test the thermal imager and connect to it. Please wait for a picture to appear in the module.
- Let your thermal imager warm up for at least 15 seconds.
- Select the desired shooting angle and adjust the focus of the thermal imager by rotating the lens ring.
- Click on the Snapshot button in the module.
- Repeat steps 11-12 as many times as necessary.
- To finish the process and proceed to viewing snapshots, click on the Switch off the camera button or click on the desired image in the gallery of thermal imaging module.
- Calibrate all captured images. To do this, enter the temperature value from the sensor in the field of the calibration panel and click on the Calibrate The mouse cursor will change its shape to a cross. Adjust the mouse cursor over the area of the image where the sensor is located and click on it. The mouse cursor will become standard. Calibration is complete.
- Now you can explore images by using analysis tools and viewing the analysis section.
IMORTANT! The absolute temperature values displayed by the thermal imager are approximate and mandatory calibration is required. After calibration, the accuracy of the readings accounts for 0.18°C. For the purposes of analysis, differences in values on a human body, asymmetry, gradients, and nonstationarity are used.
Thermal imaging gallery is located on the left side of the screen. It is intended for displaying a feed of images obtained with thermal imager. There is a text field under each thermogram, that initially indicates the date and time when the shot was taken. You can change this text. You can delete thermograms by clicking on the corresponding icon.
Panel for reviewing and analyzing thermograms is in the center of the screen. It is intended for displaying and analyzing of thermograms.
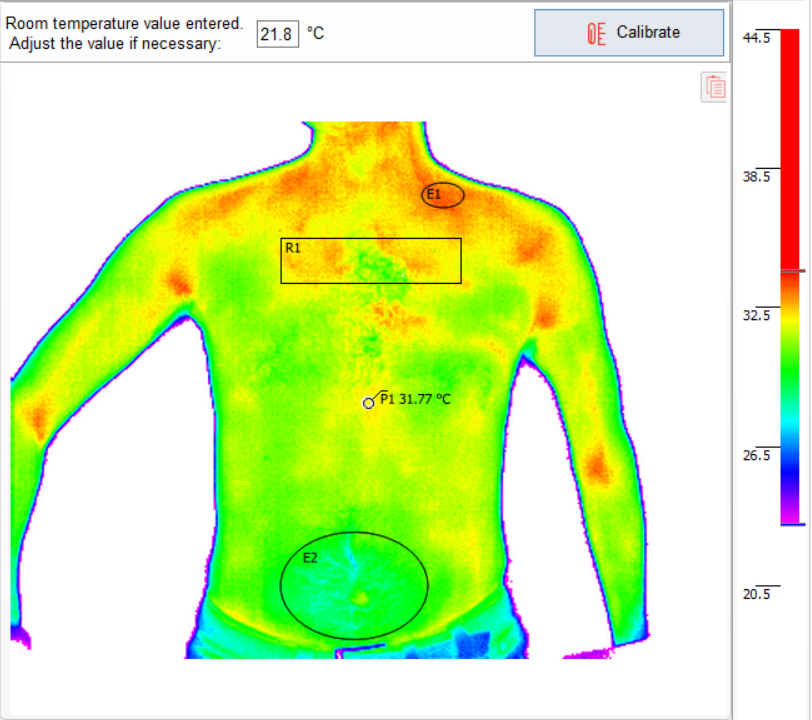
There is a button in the upper-right corner of the thermogram, that allows you to copy the image to the clipboard.
On the right part of the panel, temperature scale is located. To adjust the palette, move the mouse cursor over the top or bottom sliders of the palette, click and drag the sliders up or down to adjust. Double-clicking on the scale automatically adjusts the scale: the upper slider is set to the maximum temperature value, and the lower slider is set to the background value. The scale is adjusted individually for each image.
Toolbar is in the left part of the panel for reviewing and analyzing thermograms. It is intended for selecting thermograms analysis tools. Contains marker installation tools: point, line, rectangular zone, ellipse, isotherms, temperature grid.
To select a tool, click on the corresponding button, it will be highlighted in gray:
- When selecting the Point tool by clicking the mouse on the thermogram, the point marker is set, and information on it is displayed in the analysis section (Indices) on the right (absolute temperature will be displayed). To move a point, press the left mouse button, move the mouse cursor to the desired location, and release the button.
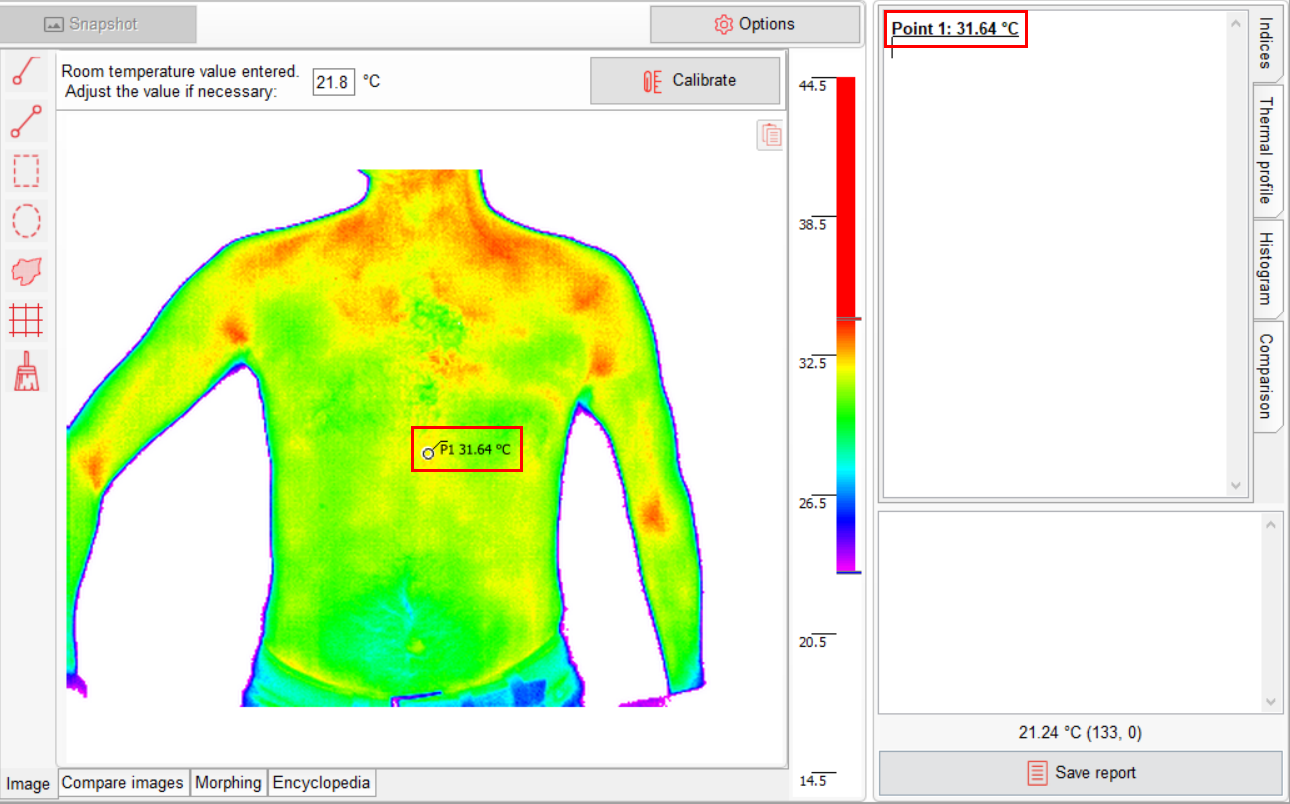
- When selecting the Line tool, move the mouse cursor to the desired initial point, press the left mouse button, and drag the cursor to the end point. Release the button. Points connected by a line are fixed on the thermogram, and the information is displayed in the analysis section (Indices) on the right: T max., T min., Tips dT, dT max-min, average T, mode T, length.
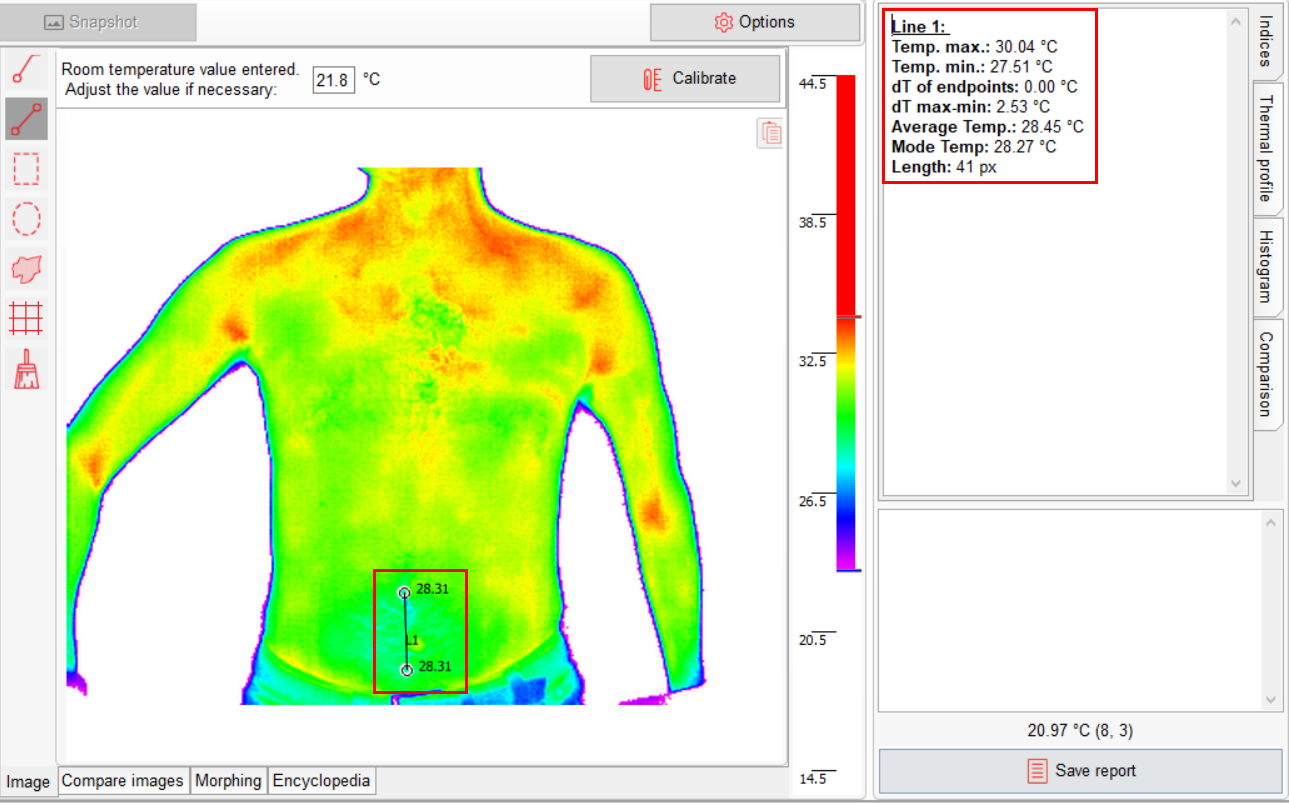
When selecting the Rectangular zone tool, point the mouse cursor to the desired initial point, press the left mouse button, and drag the cursor to the end point. Release the button. On the thermogram, the points of the upper-left and lower-right corners of the rectangle are fixed, the rectangle is drawn, and its information is displayed in the analysis section (Indices) on the right: Temp max., Temp min., dT max-min, average Temp, moda Temp, square.
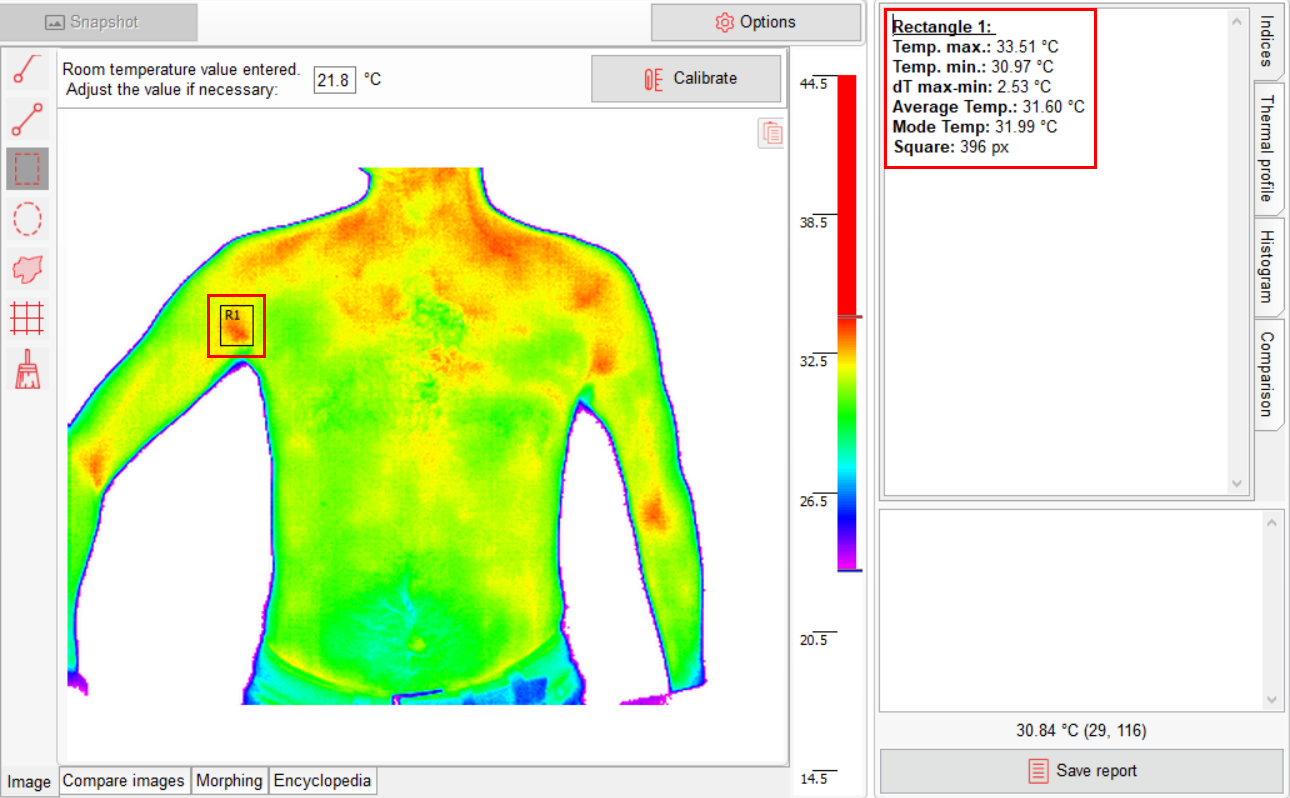
- When selecting the Ellipse tool, move the mouse cursor to the desired initial point, press the left mouse button, and drag the cursor to the end point. Release the button. On the thermogram, the points of the upper-left and lower-right corners of the described rectangle are fixed, an ellipse is drawn, and its information is displayed in the analysis section (Indices) on the right: Temp max., Temp min., dT max-min, average Temp, moda Temp, square.
- When selecting the Isotherms tool, by clicking the mouse, either all or only related areas with a temperature close to the temperature of the selected point are highlighted on the thermogram (differing by no more than the value in degrees specified in the greater or lower side). The analysis section (Indices) displays the zone parameters: temperature, square, and perimeter.
- When selecting the Temperature grid tool, a grid from several horizontal (number is specified in the settings) and three vertical lines are drawn on the thermogram. All horizontal and vertical lines, as well as grid points, can be moved with the mouse cursor. First, you need to center the median vertical line along the object's midline, and then the difference temperature at the grid points are obtained by moving one of the outer lines. A table of differential temperatures is displayed in the analysis section (Indices).
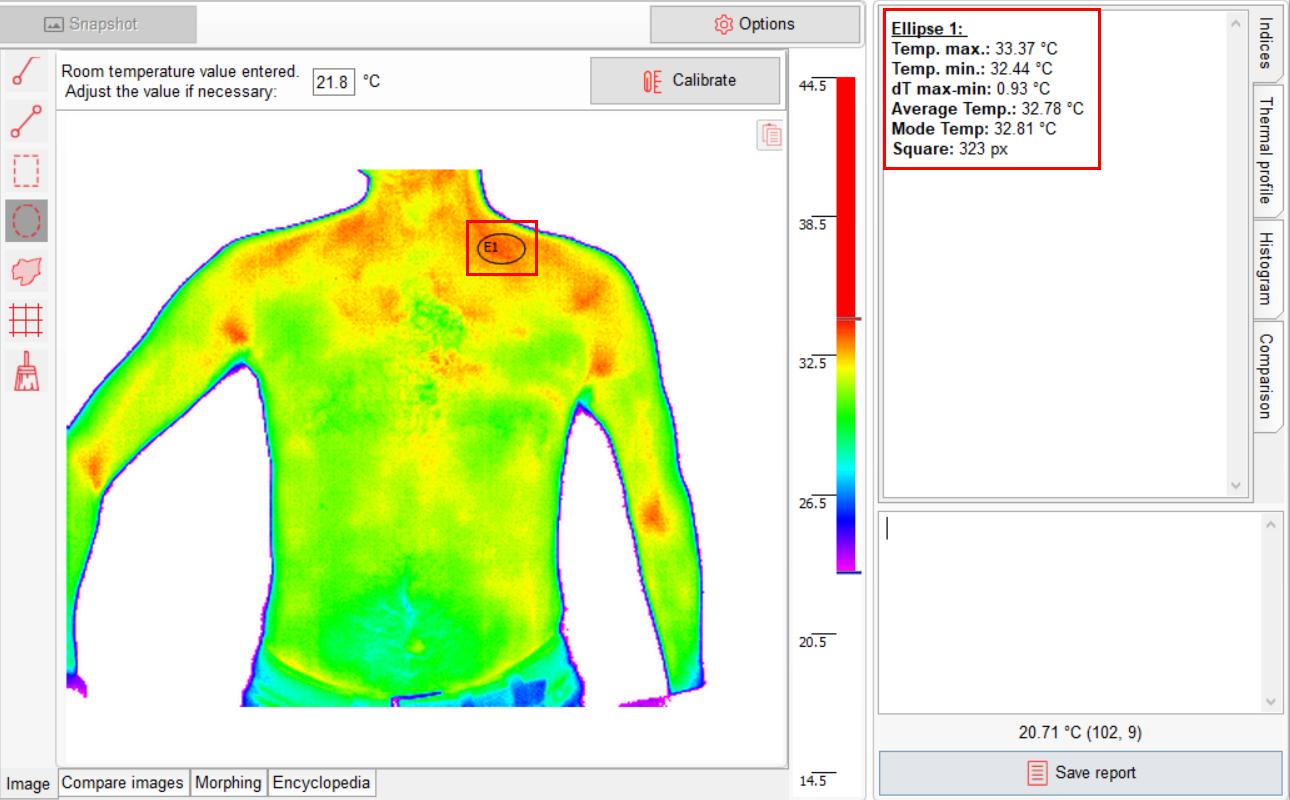
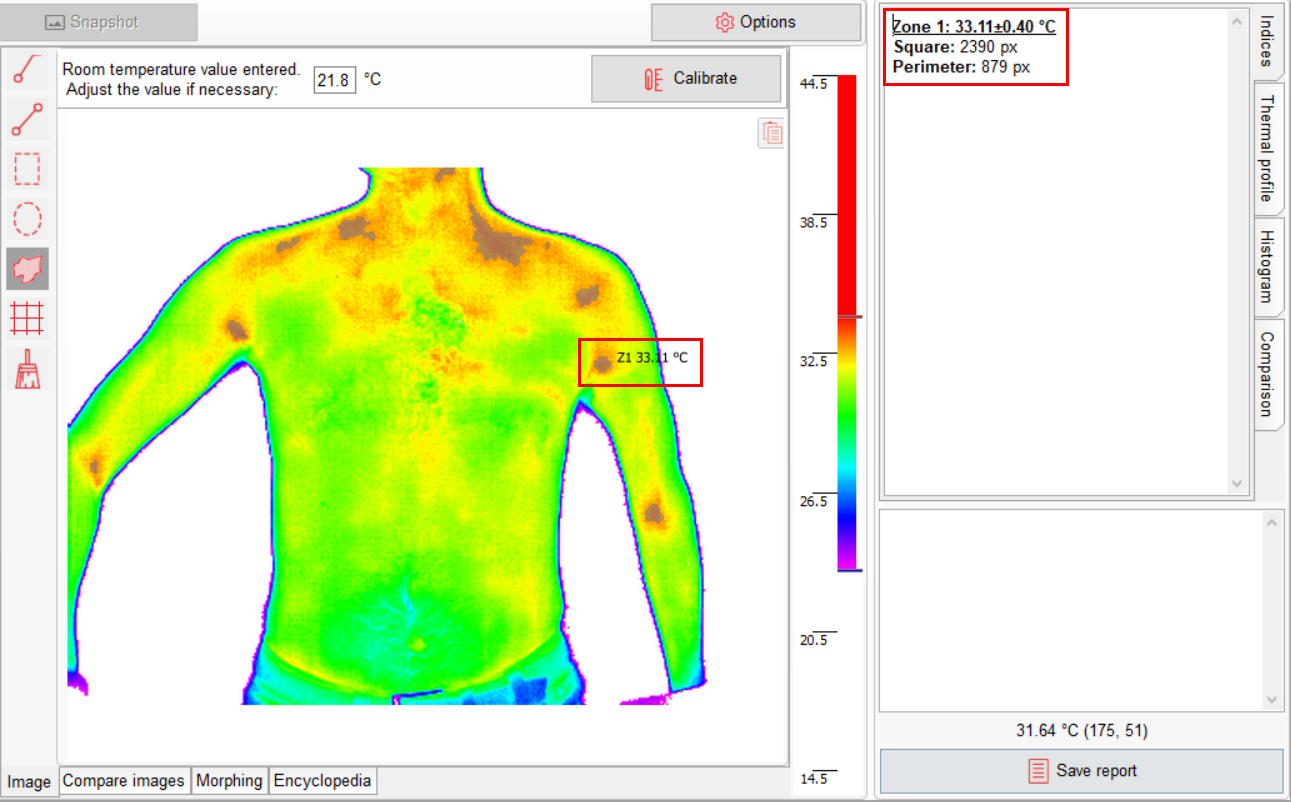
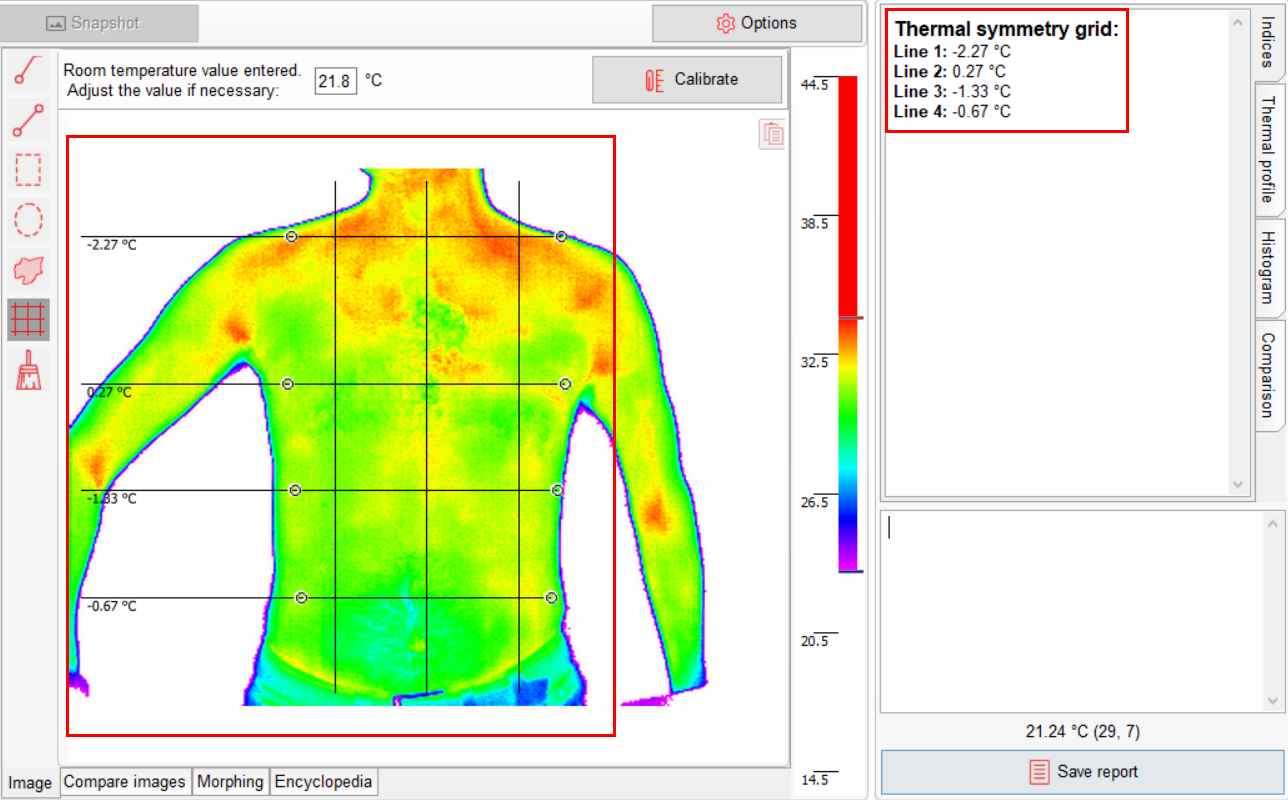
To remove any marker, select the Marker removing tool in the panel, move the cursor over the marker to be deleted (the cursor will change), and left-click.
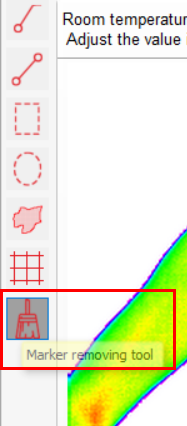
Abbreviations:
Тemp. max. – Maximum temperature on the line/in the zone
Тemp. min. – Minimum temperature on the line/in the zone
dT of endpoints – Temperature difference between end points of the line
dТ max-min. – Temperature difference between maximum and minimum values on the line/in the zone
Average Тemp. – Average temperature on the line/in the zone
Mode Тemp. – Mode (most common value) of temperature on the line/in the zone
Marker signatures on the thermogram:
P – marker point
L – line
R – rectangular zone
E – ellipse
Z – isothermal zone
Analysis Section is located on the right side of the screen and contains tabs: Indices, Thermal Profile, and Histogram.
Indices subtab is intended for displaying possible mathematical parameters of selected markers.
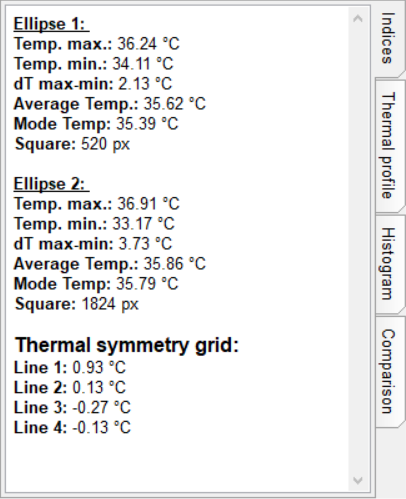
Thermal profile subtab is intended for displaying temperature graphs along the 'lines' selected on the thermogram, as well as 3D profiles for 'rectangular zones' and 'ellipses'.
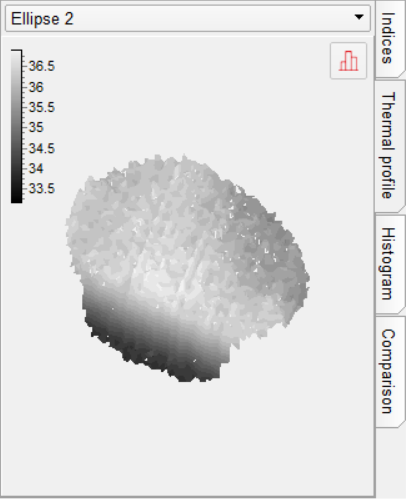
There is a button in the upper-right corner of the thermal profile that allows you to copy the graph to clipboard.
For lines, the thermal profile is interactive, i.e. the cursor appears on the graph when hovering the mouse cursor, and the corresponding point on the thermogram is highlighted, and vice versa: when you hover the mouse cursor over a line on the thermogram, the cursor on the graph moves accordingly, helping to correlate the profile with an image.
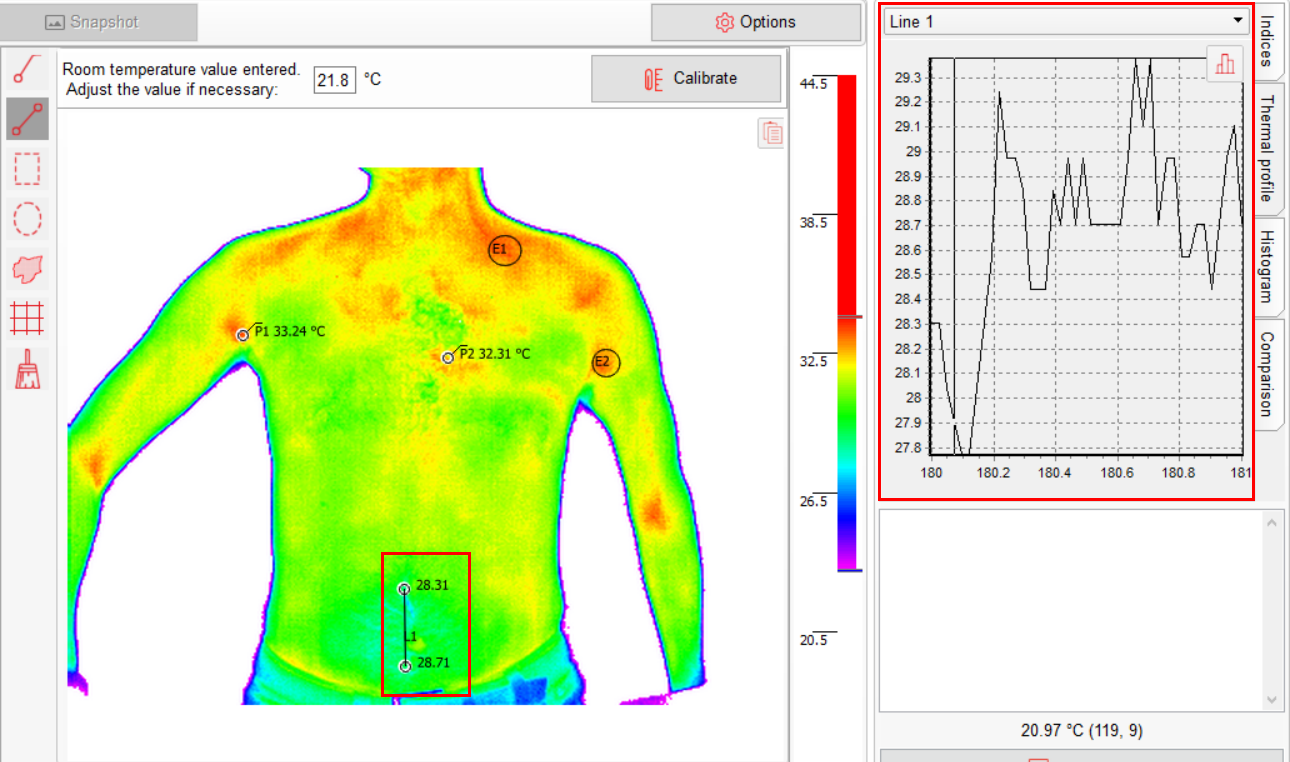
Histogram subtab is intended for displaying a temperature histogram based on the 'lines' and 'zones' marked on the thermogram. The histogram bars are highlighted in pseudo-colors corresponding to the image palette.
There is a button in the upper-right corner of the histogram that allows you to copy the diagram to clipboard.
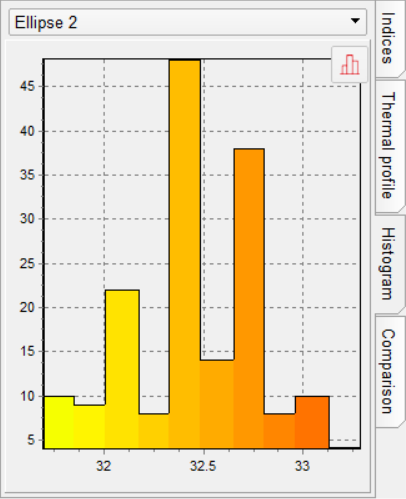
In the Notes field, you can add any comment to the thermogram, which will be saved and added to the report.
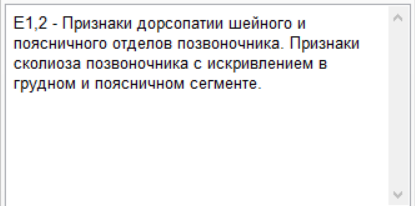
In quick analysis window, cursor coordinates and temperature information of the corresponding pixel are displayed when you move the mouse cursor over an image.

Click Save report to form a report. A thermogram with all markers, descriptions of all markers from the Indices subtab, selected thermal profile and a histogram will be inserted in this report. You can edit the text and save the report to your computer.
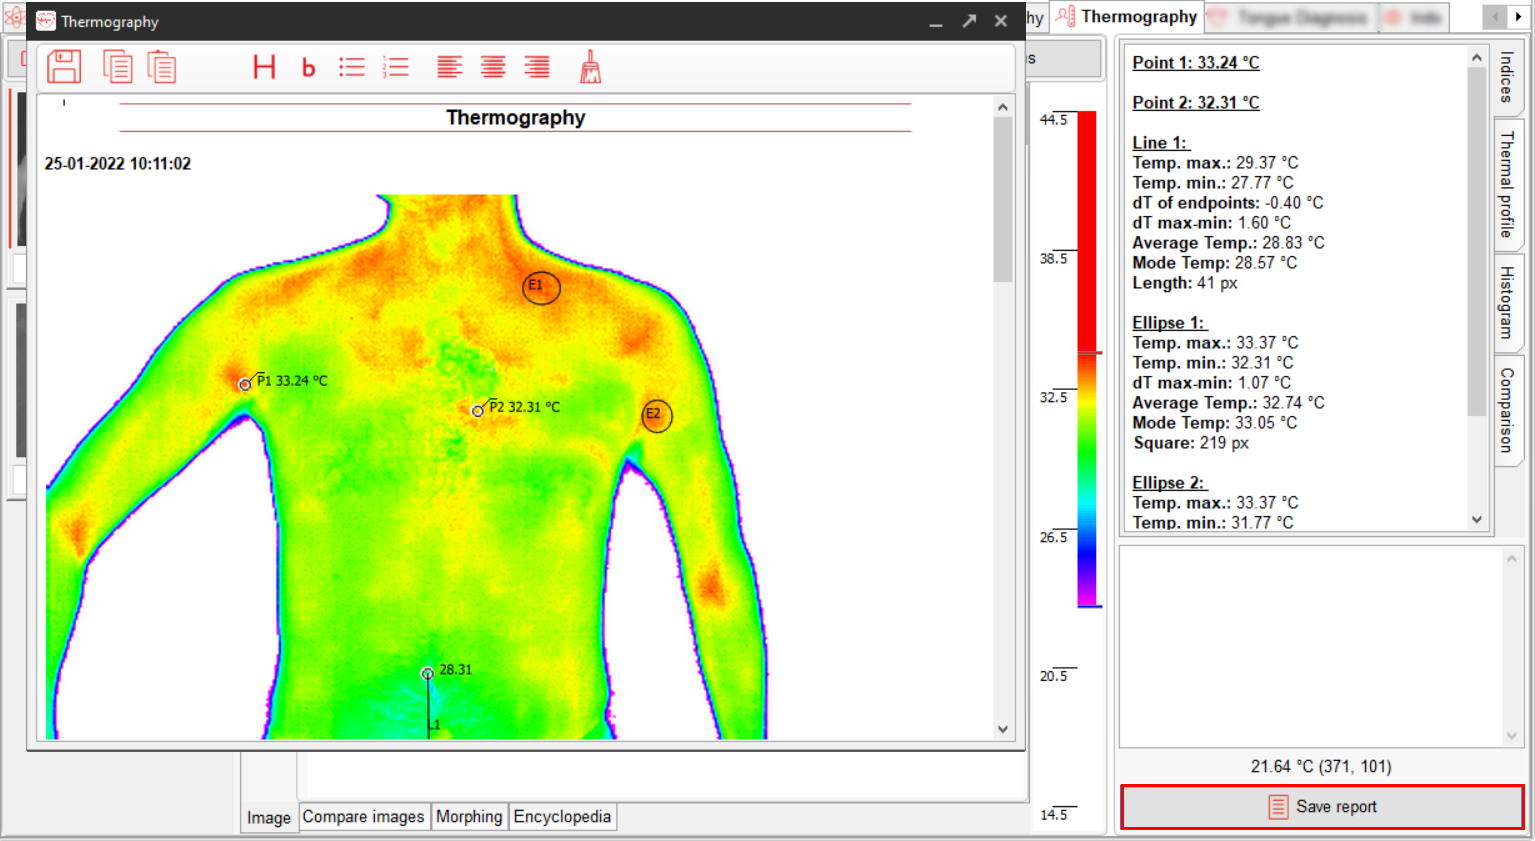
When you click on the Options button, the module settings window opens.
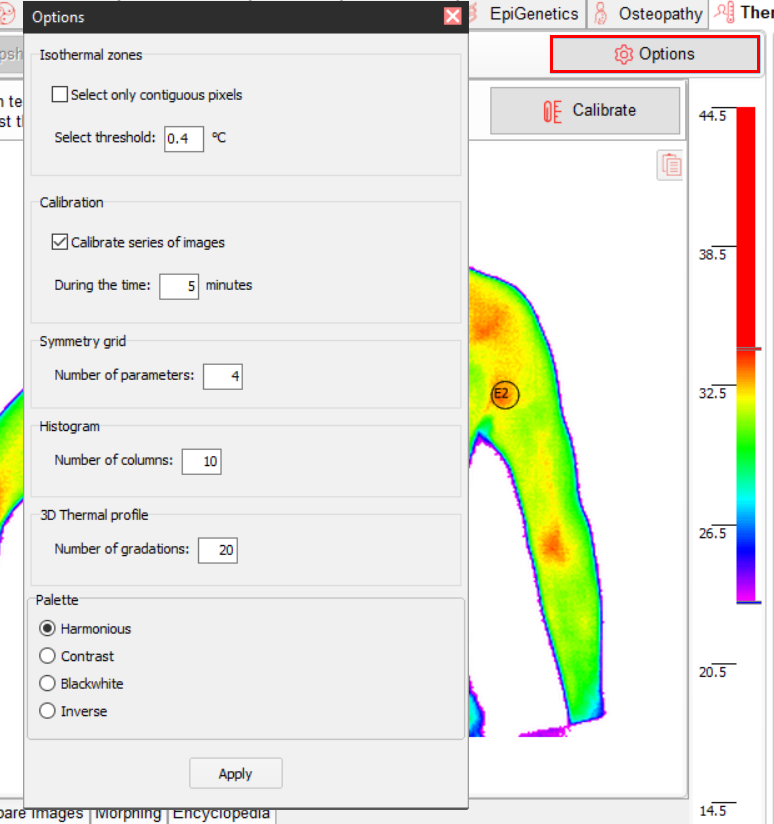
You can set the following values:
- Isothermal zones select threshold (selection range – temperature of the selected point ± specified value), continguity;
- Number of rows in symmetry grid;
- Number of histogram columns;
- Color number of 3D thermal profile.
IMPORTANT NOTE! An increase in the number of colors leads to a significant load on the PC, which may cause slow response in PCs with technical specifications lower than recommended.
Select a palette:
- Harmonious (with the same saturation of all colors);
- Contrast;
- Black and white (white is hot, black is cold);
- Inverse (black and white, white is cold, black is hot).
The set values are applied for a specific thermogram.
Compare images
Within the Thermography module, you can compare several thermograms (up to 6).
To do this, go to the Compare images subtab at the bottom of the screen. Next, select the images you want to compare from the thermogram gallery by checking the box in the upper left corner.
The selected thermograms will appear on the viewing panel in the central part of the screen.
On the thermograms, specify the points whose temperatures you want to compare.
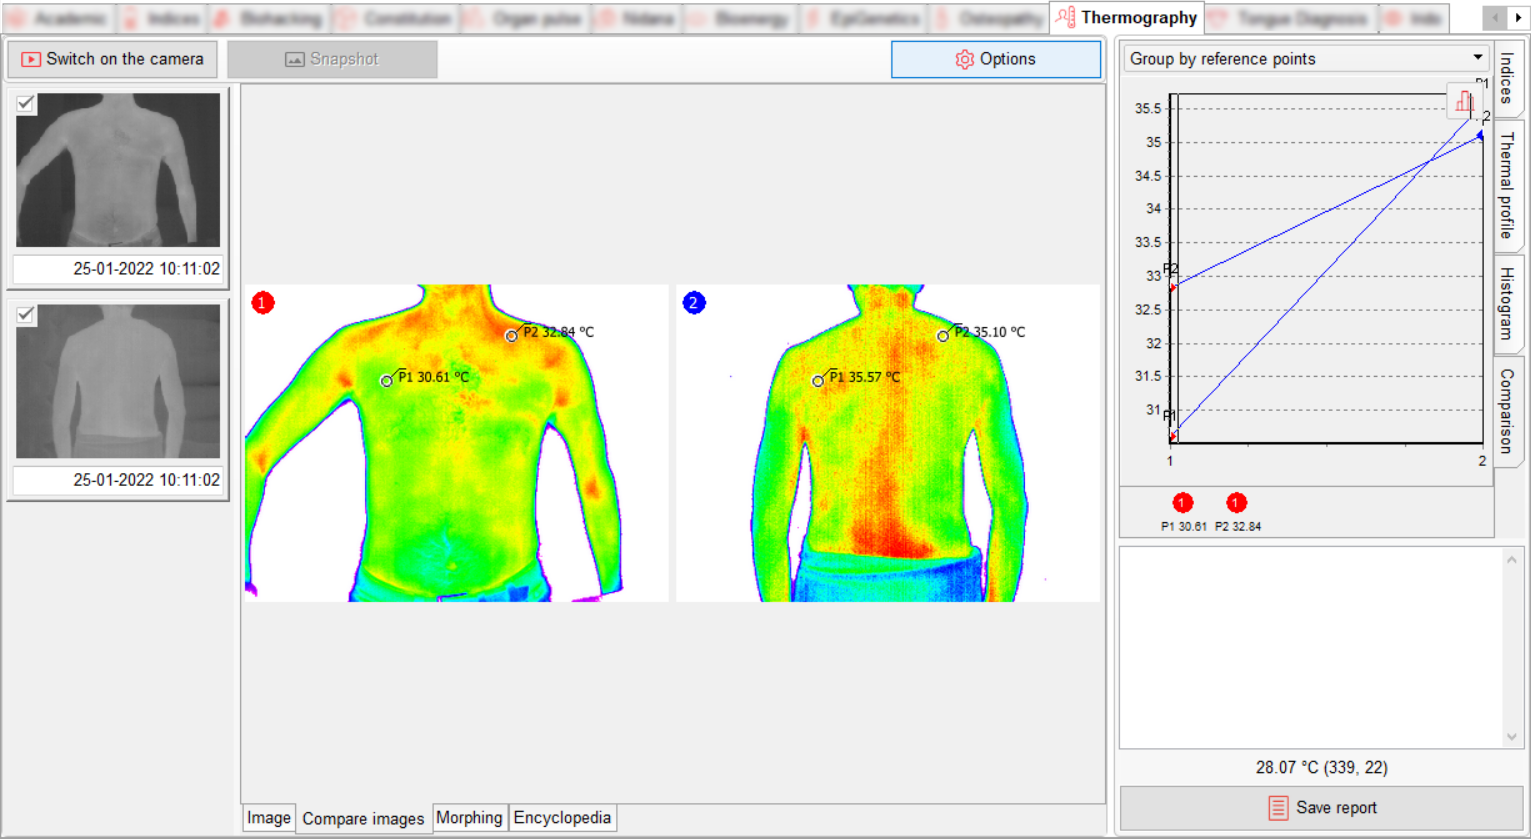
The points can be moved. To do this, move the cursor over the point and, holding down the right mouse button, drag the point.
At the same time, a new Comparison subtab will appear in the analysis block, allowing you to compare thermograms at specified points in the form of linear graphs.
Graphs can be copied to the clipboard by clicking on the corresponding icon.
Morphing
Morphing allows you to overlay two images (thermograms) on top of each other. In this case, one image will gradually transform into another.
To do this, select two thermograms in the gallery by checking the box in the upper left corner.
Click on the Playback icon in the central part of the viewing panel. You will see how one image has transformed into another.
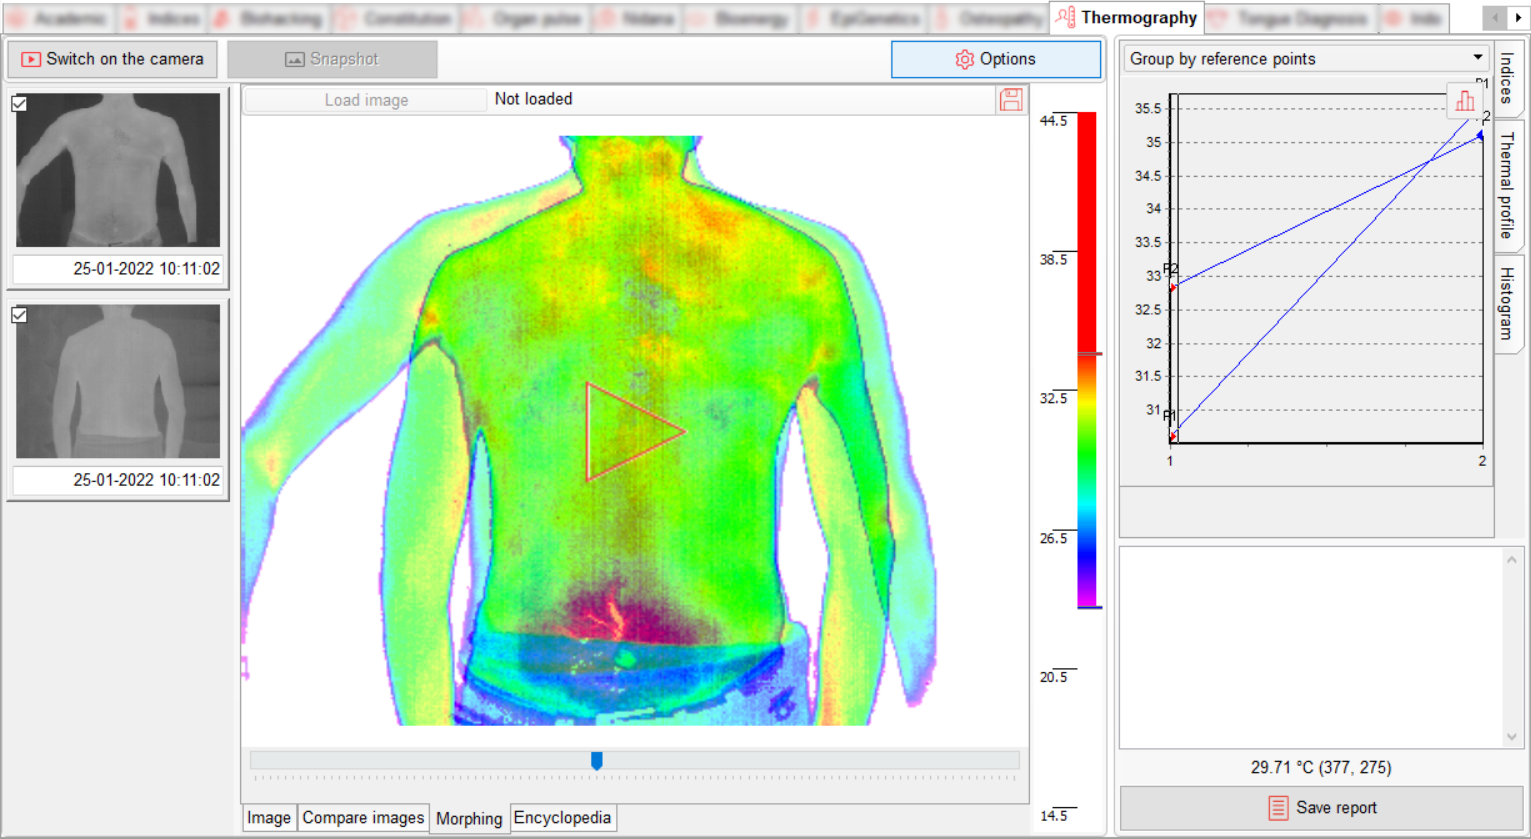
You can also morph a thermogram and an image downloaded from a computer. To do this, click on the Load image button and select an image.
You can move to any point of the image morphing by moving the trackbar cursor.
Encyclopedia
The Encyclopedia of the Thermography module is an interactive guidebook that contains information about the anatomical topography of the projection zones of internal organs. Knowing the location of these zones and comparing it with the patient's thermogram data, the specialist will be able to conduct a more accurate analysis of the thermogram data, assess the foci of local temperature changes on the human body in a particular projection zone.
To do this, select the desired area/zone from the drop-down list on the left and this zone will be highlighted in a separate image, and the description text will be displayed in the text field below.
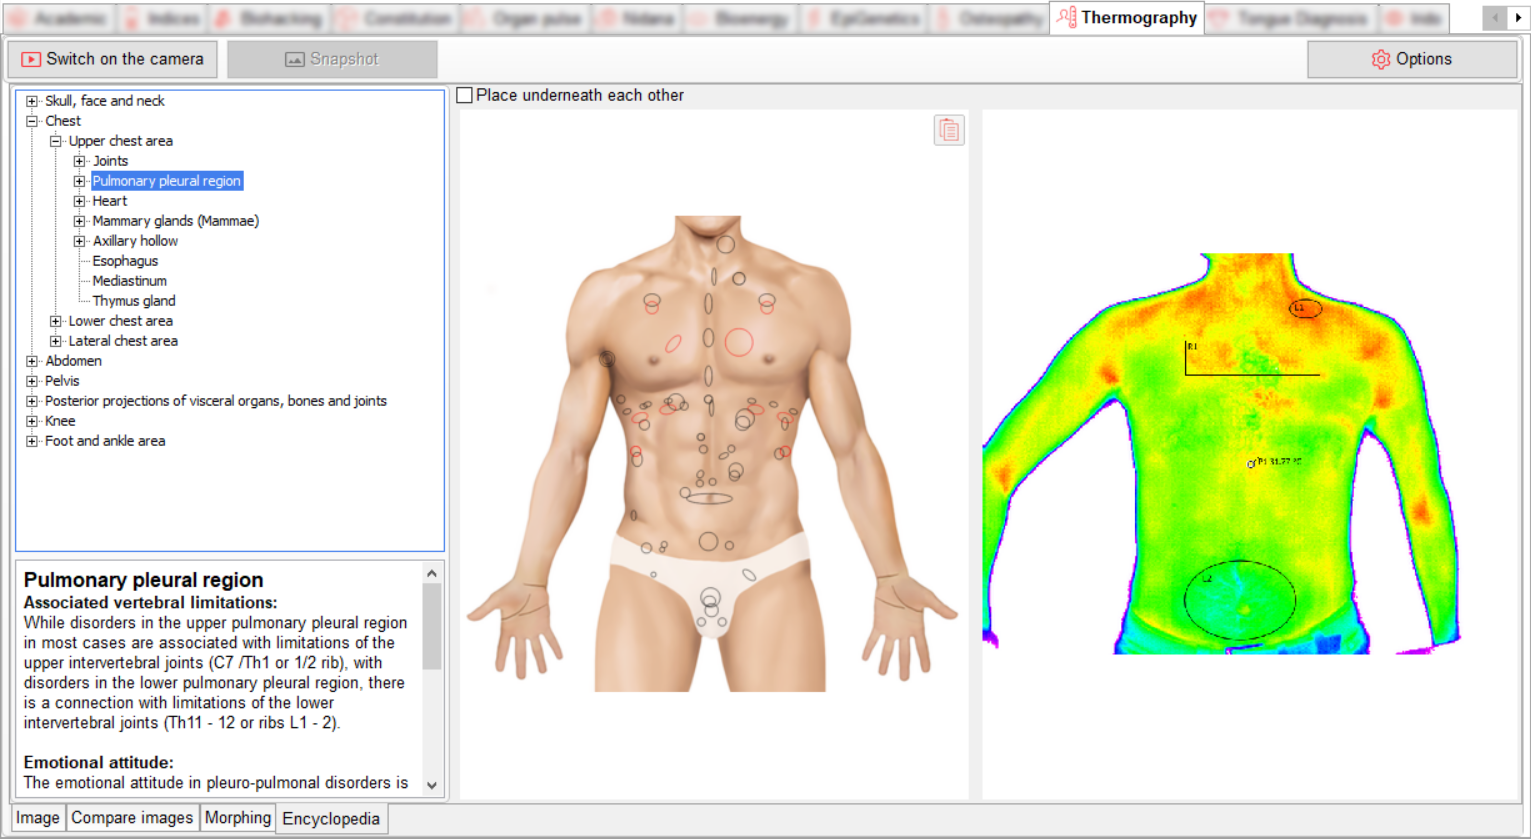
Tooltips appear when you hover over the zones in the image.
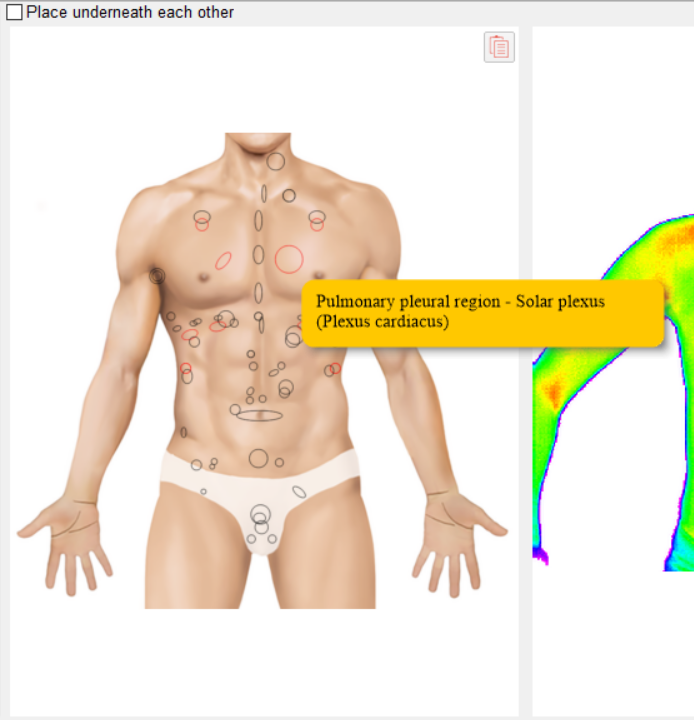
Click on the zones to see their description.
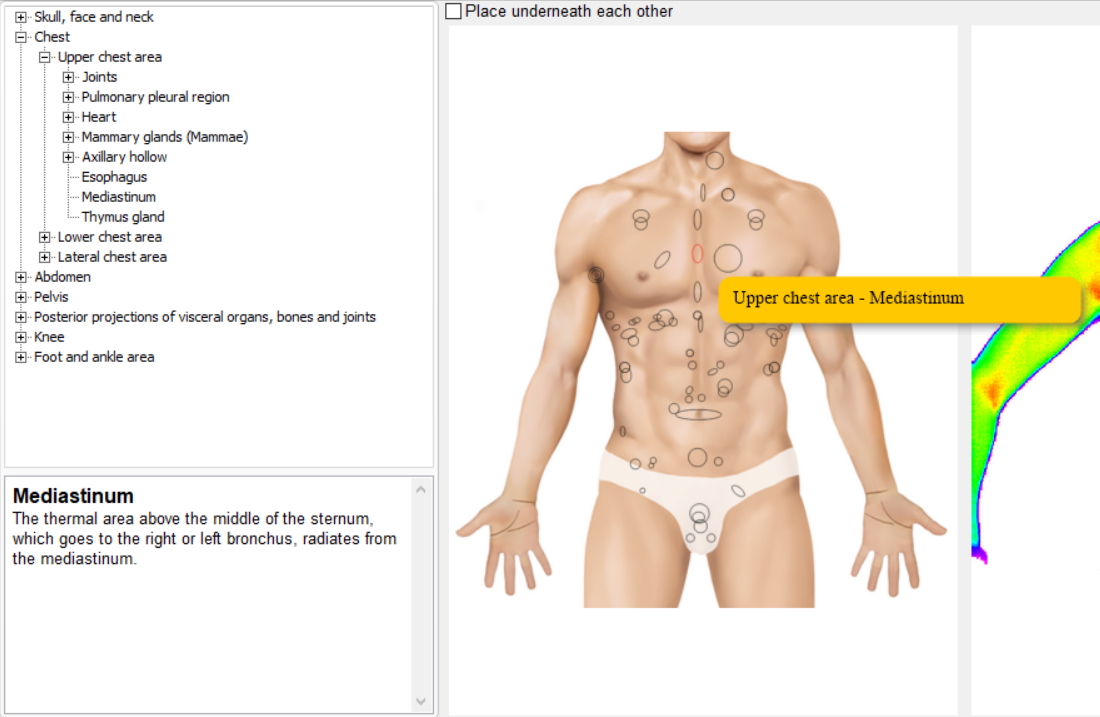
Place underneath each other function allows you to change the location of images – two in a row / one under the other.
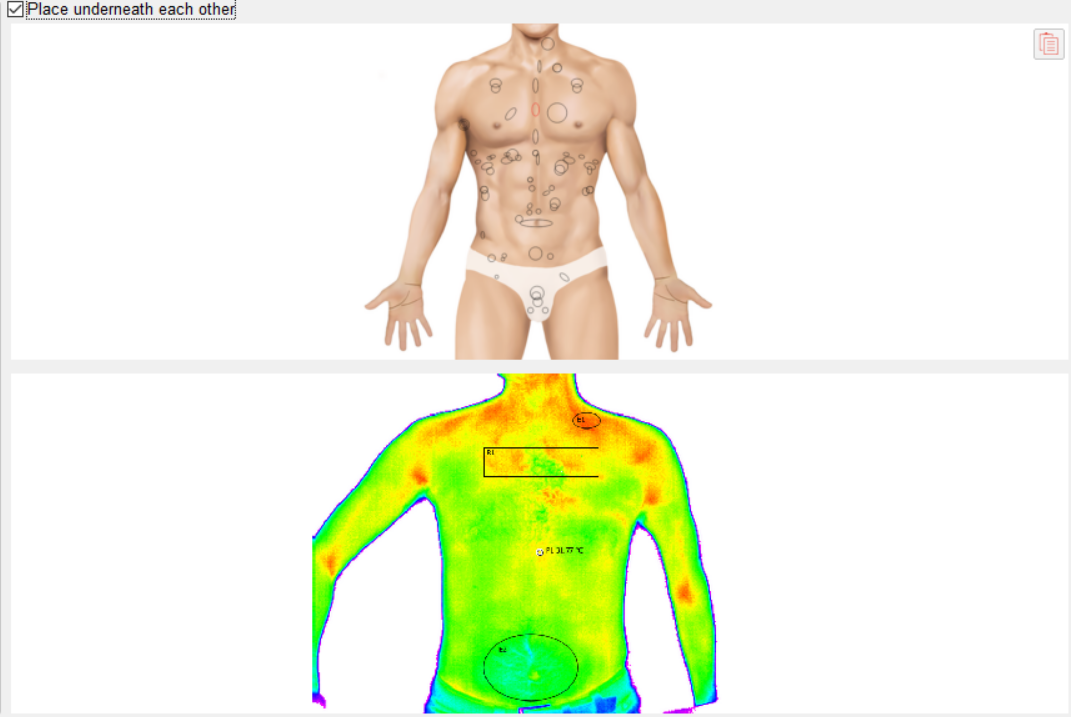
The encyclopedia image can be copied to the clipboard by clicking the ![]() .
.
Detailed information about the module
Biohacking
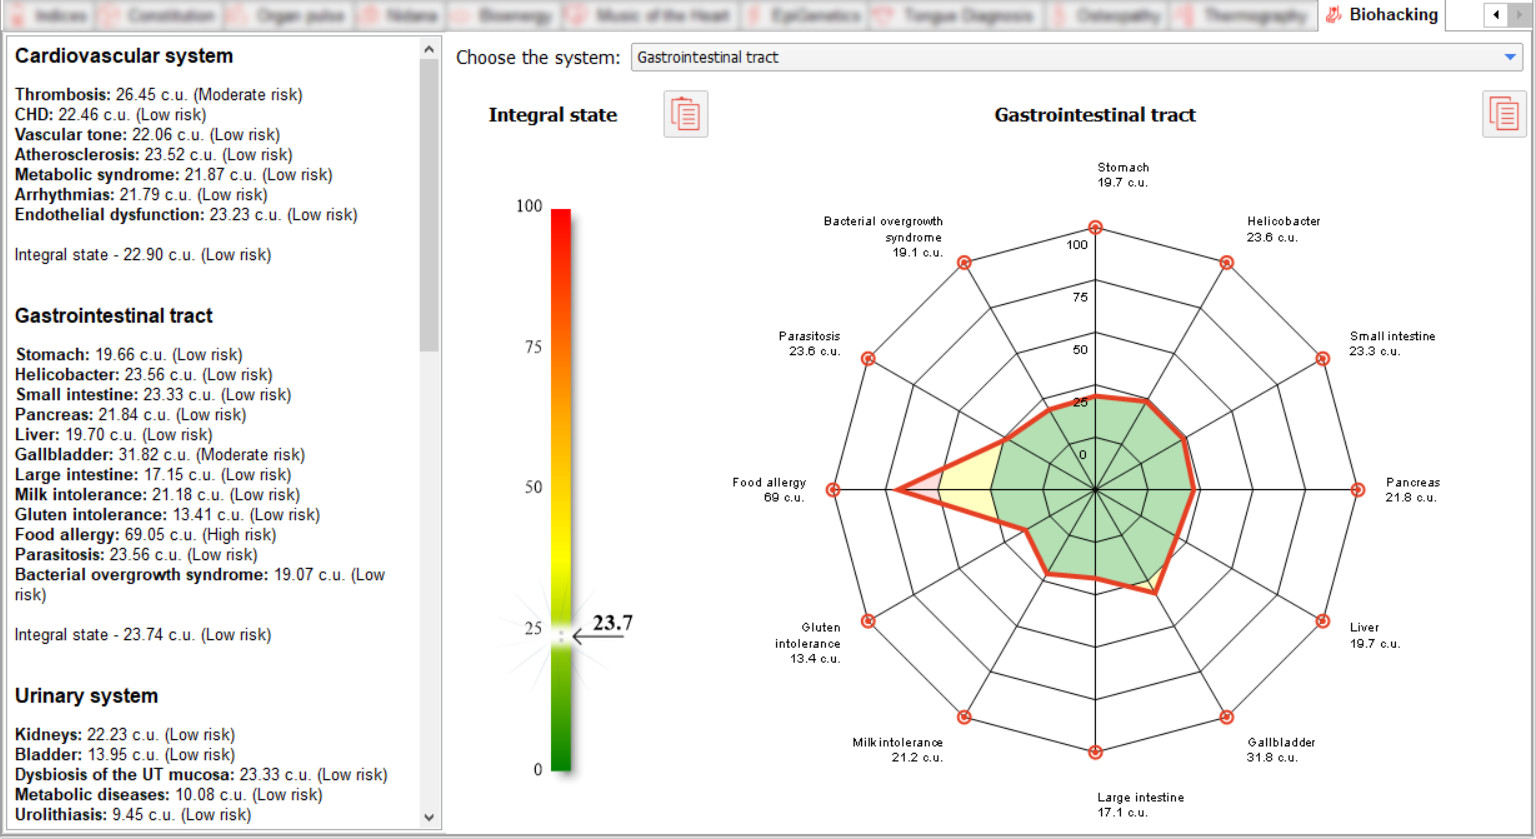
Software module «Biohacking» allows you to determine the risk of developing diseases and pathological conditions.
With the module you can easily identify 52 pathological trends in vital body systems:
• cardiovascular,
• gastrointestinal,
• urinary,
• reproductive,
• endocrine,
• immune,
• detoxification systems,
• as well as neuro-psychological disorders.
To select a system, use the drop-down list located on the left side of the screen above the diagram.
The module displays the degree of risk in 4 main zones: low (0-25), medium (25-50), high (50-75) and very high (75-100) risk of development on charts. When the cursor is hovered over the chart, tooltips appear explaining the current risk.
The general tension in the system is displayed on the Integral State scale.
The text block displays information about the risks of developing diseases and pathological conditions for all systems, expressed in conventional units (c.u.).
Both graphs can be copied to the clipboard using the
![]() .
.
Cardiovascular system
Analysis of the patient's cardiovascular system using VedaPulse allows the specialist to assess the following
risks:
• Coronary heart disease;
• Increase in cholesterol levels;
• Development of metabolic syndrome;
• Haemostasis disorders;
• Occurrence of arrhythmia;
• Severity of endothelial dysfunction;
• Vascular tone disorders.
Gastrointestinal tract
When analysing the gastrointestinal tract, VedaPulse allows you to determine the risks of developing:• Diseases of the stomach, small and large intestine;
• Abnormalities in the secretory function of the pancreas;
• Stress in the function of the liver detoxification system;
• Biliary and gallbladder motility disorders;
• Tendency to develop food allergies and intolerance to gluten and milk;
• Risk of developing bacterial overgrowth syndrome and protozoal infection.
Urinary system
The module identifies risks of:
• Impaired kidney function;
• Bladder inflammation;
• Dysbiosis of the distal urinary tract;
• Metabolic kidney disease;
• Urolithiasis.
Reproductive system
Functional biohacking of female and male hormone system parameters using VedaPulse:
• Risk assessment of mastopathy;
• Analysis of the hormonal balance of oestrogens/progestins;
• Violations of the ovaries hermenative function;
• The likelihood of developing hyperproliferative and erosive processes of the cervix and uterine wall;
• The likelihood of mucosal dysbiosis with the development of bacterial vaginosis and сandidiasis in women and
balanoposthitis in men;
• Testosterone levels and the efficiency of spermatogenesis;
• The risk of developing prostate adenoma.
Endocrine system
Endocrinological screening using functional diagnostic methods:
• Rapid assessment of thyroid hormone levels and the severity of low T3 syndrome;
• The presence and severity of insulin resistance and the dynamics of its regression with rational nutritional
therapy;
• Assessment of "fatigued adrenal syndrome" as a correlate of "chronic fatigue syndrome";
• The tendency to develop dyslipidaemia and the dynamics of its recovery with nutritional support;
• Disorders of haem metabolism and risk of iron deficiency;
• Stratification of the risk of calcium metabolism disorders.
Immune system
The module identifies the following risks:
• Determine the integral immunological resistance, which allows the restoration of immunity after colds or any
inflammatory diseases;
• Calculate the risk of hypersensitivity or allergic reactions to assess the effectiveness of desensitization to
antigens;
• Evaluate the activity of autoimmune reactions;
• Stratify oncological vigilance;
• Analyse the risk of persistence of chronic viral infections.
Neuro-psychological disorders
Functional biohacking of neuro-psychological disorders with VedaPulse:
• Assessment of the propensity to develop pharmacological, gambling and alcohol addictions;
• Risk of early cognitive impairment;
• Assessment of the severity of emotional disturbances;
• Signs of impaired cerebral circulation and venous outflow;
• The degree of development of neuroinflammation and reduction of neuroplasticity.
Detox
Functional biohacking of the patient's detoxification system with the VedaPulse device:
• Assessment of the effectiveness of the body's detoxification systems and the level of accumulation of
metabolic by-products ("metabolic toxins");
• The severity of autonomic dysfunction against the background of the body's slagging;
• The level of systemic inflammatory response, which reflects the activity of the inflammatory process in the
body.
Statistics
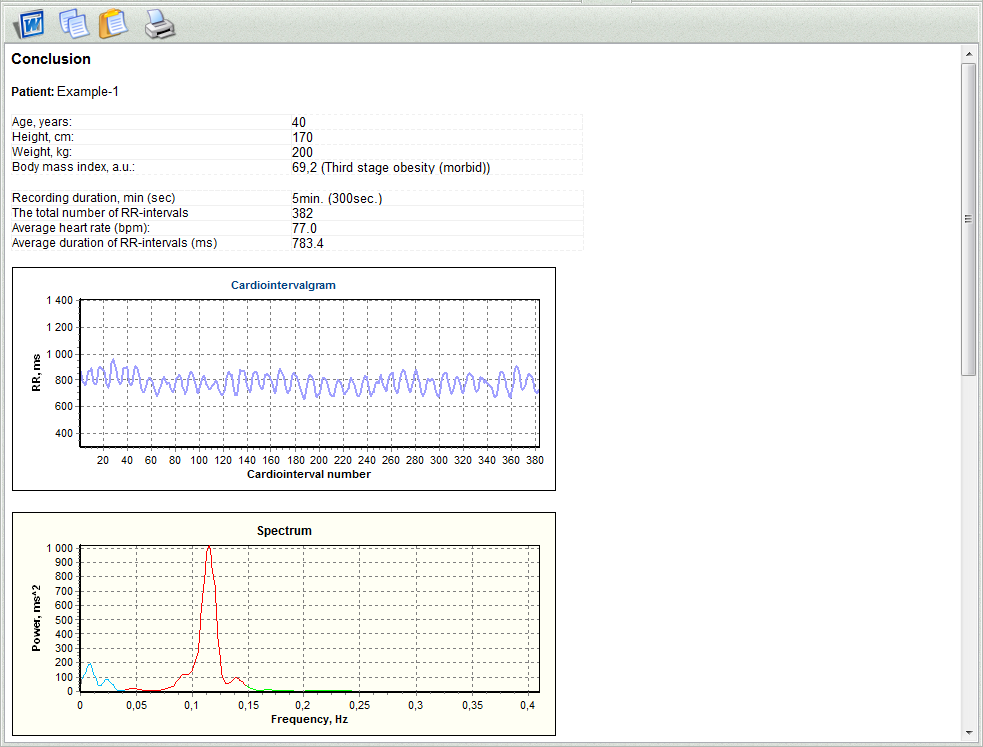
Automatically puts all of the data from the HRV, Spectrum, Histogram tabs into one document that can be saved in RTF format.
Recommendations
Recommendations contains tabs: Lifestyle, Herbal Encyclopedia, Aroma Encyclopedia, Supplements Encyclopedia, Diet, Yoga, Acupuncture, Massage, Biorhythms, Auriсulotherapy, EHF, Quantum Therapy, Report. The General rule for all tabs in the Recommendations is that the recommendations are generated according to the constitution (VATA, PITTA, KAPHA), which is calculated on the basis of the assessment results. Therefore it is very important to use a properly conducted assessment, which reflects not the immediate reaction to any short-term factors, but long-term functional status. In more detail the question of the constitution was considered in the article:
Lifestyle
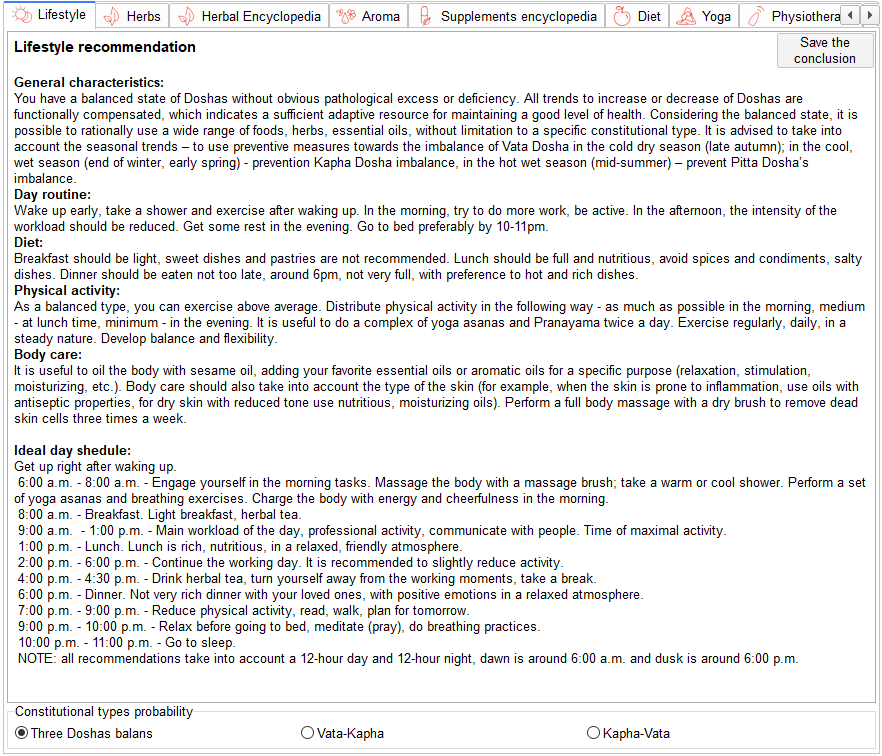
The module presents recommendations on lifestyle, taking into account constitution of the patient. It describes each of the 10 basic constitution types, including 3 monotypes (Vata, Pitta, Kapha), 6 dual types (Vata-Pitta, Vata-Kapha, Pitta-Vata, Pitta-Kapha, Kapha-Vata, Kapha-Pitta), and the 10th – balanced Tridosha type. In case of uncertainty of dual type probability, it is possible to choose lifestyle for each type. If you see several constitution types suggested by the “Heuristic analysis of the Doshas balance probability” as having the certain probability in the Balance tab, the specialist has an option of choosing constitution in the lower part of the window – “Constitutional type probability”.
Herbal Encyclopedia
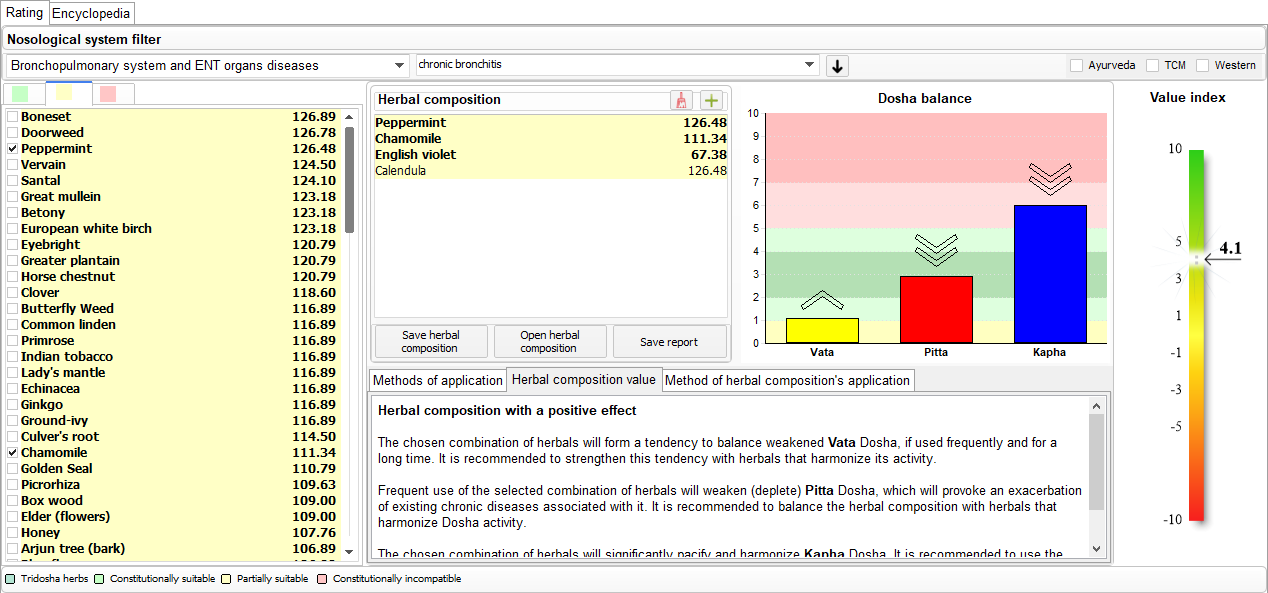
Expert extension “Herbal Encyclopedia” allows to solve the following tasks:
- To generate a personified phytotherapeutic prescription;
- To form a list of medicinal plants, constitutionally suitable for a particular patient, to rank medicinal plants taking into account the current functional state, calculate the force of influence of each plant on a particular patient;
- A graphic visualization of the effect of a herbal composition on the Dosha balance;
- A new index of the usefulness of the herbal composition;
- Automatically generated text content describing the effect of the herbal composition on Doshas.
- To search a plant on the given parameters: Ayurvedic properties, properties according to TCM, clinical characteristics (botanic name, synonyms, family, etc.);
- To get a detailed description of the technology of preparation and method of applicatin of medicinal raw materials;
- To form a list of medicinal plants, constitutionally suitable for a particular patient, to rank medicinal plants taking into account the current functional state, calculate the force of influence of each plant on a particular patient;
- To get a detailed description of the technology of preparation and method of application of medicinal raw materials;
- A description of the constitutional properties of medicinal plants from the point of view of Western herbal medicine, Ayurvedic and Traditional Chinese medicine
- An automatic generation of a report with phytotherapy prescription.
Expert extension is located in the main menu of the program “VedaPulse Professional”, in the Recommendations tab. The module consists of the Rating and Encyclopedia tabs.
Rating Tab
This section of the module allows you to create a personified phytotherapeutic recipe based on different nosological factors and the choice of medicine: Western, Chinese or Ayurvedic.
All plants get divided into three lists: Green, Yellow and Red.
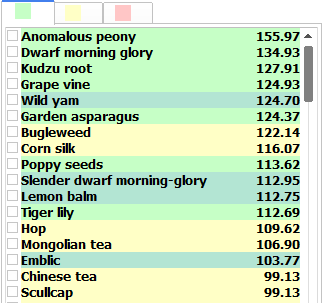
- The green list - includes plants that are the most effective taking into account the constitution type of the patient.
- The yellow list - consists of plants that have a partial constitutional compliance and may be used for the patient.
- The red list - represents plants that are contraindicated for the patient as they can worsen his condition.
All the plants are divided into four categories: Tridosha plants, Constitutionally suitable plants, Partially suitable, Constitutionally inappropriate plants. For each category there is a conditional color designation displayed in the legend below the list. Regardless of the category, the plants can fall into any of the lists (green, yellow or red).
Nosological system filter contains more than 250 pathological conditions – one has an option to choose up to 2 diseases at once - for example, hypertension and diabetes.
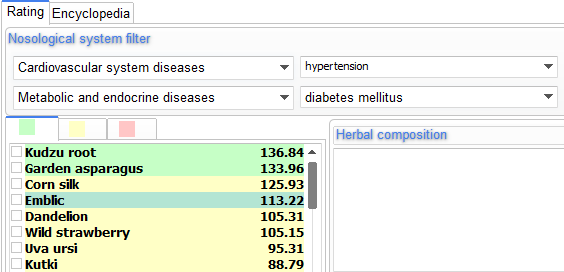
There is also an option of additional filtering of the list – it is possible to display plants used in a particular medicine or more than one medicine at the same time (the list will include plants used in both schools).
Having chosen a plant from the main list one would see the following information in the “Methods of application” window – Botanic name, Latin name (also Sanskrit and Chinese name depending on the chosen filter), traditional and classical methods of application (decoction, infusion, etc.).
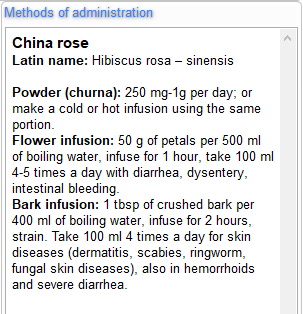
When marked with a tick in the list the plant is placed in a separate window “Herbal composition” where you form a list of plants for the patient (from any of the lists).
The Dosha Balance graph reflects the power of influence of the herbal composition on individual Dosha in the form of the arrows - power of influence.
The arrows pointing upwards indicate an increasing action, downwards – a decreasing one. There can be from one to three arrows or there can be none of them:
- 3 arrows – potent herbal composition
- 2 arrows – moderately acting
- 1 arrow – weak
- No arrow – neutral effect
On the index scale of the Composition value, the total utility of the herbal composition is displayed in the range from -10 to 10:
- From 5 to 10 – Herbal Composition with a pronounced positive effect. It has a balancing and harmonizing effect. As well as pronounced therapeutic effect.
- From 3 to 5 – Herbal Composition with a positive effect. It has a balancing effect on the Doshas.
- From 1 to 3 – Herbal Composition with a weak positive effect. It does not have any pronounced therapeutic effect. Effective only for cosmetic purposes.
- From -1 to до -1 – Neutral effect of Herbal Composition
- From -1 to -3 – Herbal Composition with a weak negative effect
- From -3 to -5 – Herbal Composition with a negative effect. It has a negative effect on the psychophysiological processes and the Dosha balance. It is not recommended for use.
- From -5 to -10 – Herbal Composition with a pronounced negative effect.It has a significant unbalancing effect even with short-term use. It is highly not recommended for use. Even with short-term use, it can lead to serious side effects.
The variants of the influence of the herbal composition are described in text format taking into account the current person's constitution and reflect possible effects on the body. Should be clarified that it is necessary to consider individual characteristics of a person, their diseases and sensitivity to the ingredients of herbal.
In the window “Method of herbal composition’s application” the expert adds his own recommendations for use and preparation of the plants, including by copying or dragging the information from the “Methods of application” window.
It is possible to add a new plant which is not included into encyclopedia by clicking “+” icon and filling the necessary graphs. Later on you will be able to use saved plants in other recipes by clicking “+” icon and adding the plant from the formed list. You can also edit or delete saved plants.
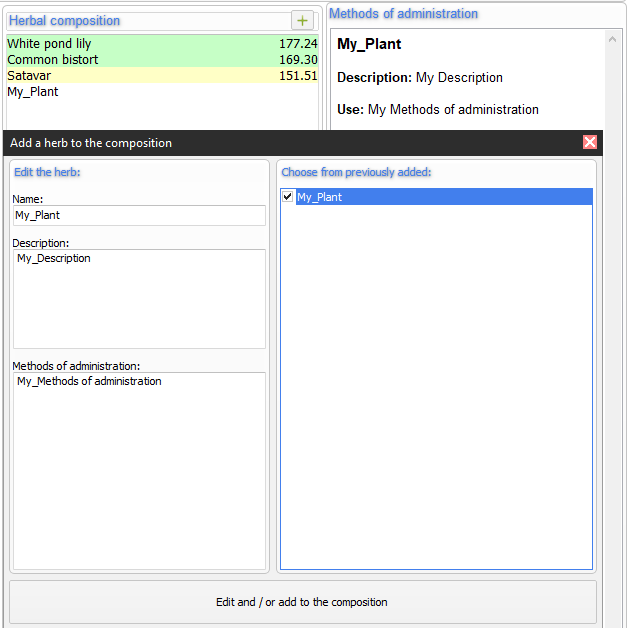
It is possible to save the formed herbal composition in the program by clicking “Save herbal composition” and giving it a name, for example “Herbal composition in hypertension and diabetes".
Later on you will be able to use the saved recipe for another patient by uploading it first and then choosing it in the pop-up menu “Open herbal composition”.
In the same window you can remove herbal compositions you don’t need.
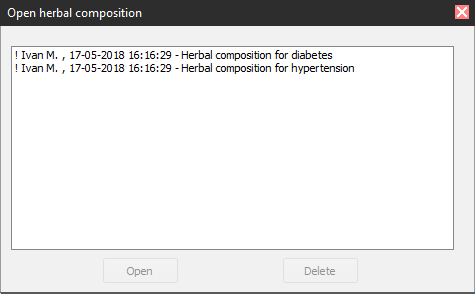
The formed herbal composition can be saved in an independent file - Report for the patient that can be printed out or sent via e-mail. Report on herbal composition contains data on the patient (anamnestic card) and on the specialist conducting the assessment.
If you need to learn more about the properties of plants as part of the herbal composition go to the Encyclopedia Tab where you can read more about their action and qualities.
- Encyclopedia Tab
It consists of four subsidiary tabs: Botanics, Clinical phytotherapy, Ayurveda, TCM.
It contains a multi-parameter search and filtration system for the quality of plants, a detailed description of the constitutional properties of medicinal plants in terms of Western herbal medicine, Ayurvedic and Traditional Chinese medicine.
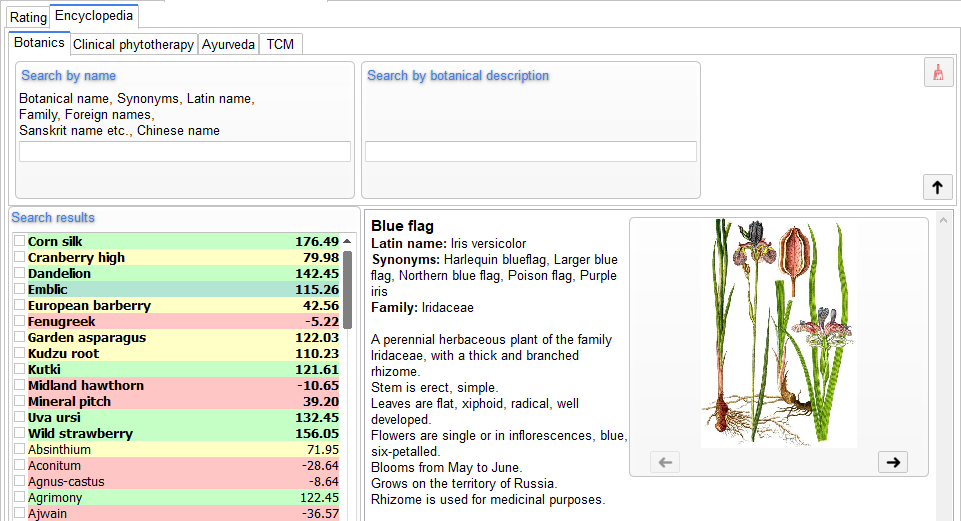
For more convinience, the searching in Herbal Encyclopedia and Aroma Encyclopedia is provided with the “Instant search” option, allowing you to see all possible options that meet the search criteria after clicking the “Search” button or right at typing (which is handy for slow-speed computers).
- Botanics tab
Botanics tab provides botanical description of medicinal plants, it includes: botanical name of the plant, Latin name, foreign name, synonyms, as well as the ability to search for plants on the above items, description.
The tab contains: illustration of the plant, description of its structure, flowering and fruiting periods, proliferation area, as well as parts of the plants used in different recipes.
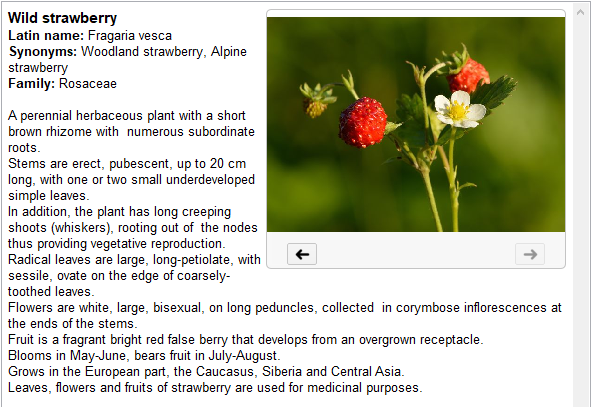
There are two filters that you can use for searching in the tab: “Search by name” (Botanical, Latin, Chinese, Sanskrit, synonyms, family), “Search by botanical description."
- Clinical phytotherapy tab
The tab describes the use of plants from the perspective of Western herbal medicine. It has a special filter - search by phytotherapeutic description. The main feature of this tab is the ability to find a plant by its medicinal properties. The list contains more than 90 standard properties of medicinal plants according to classical Western herbal medicine (hepatoprotector, aphrodisiac, adaptogene, etc.)
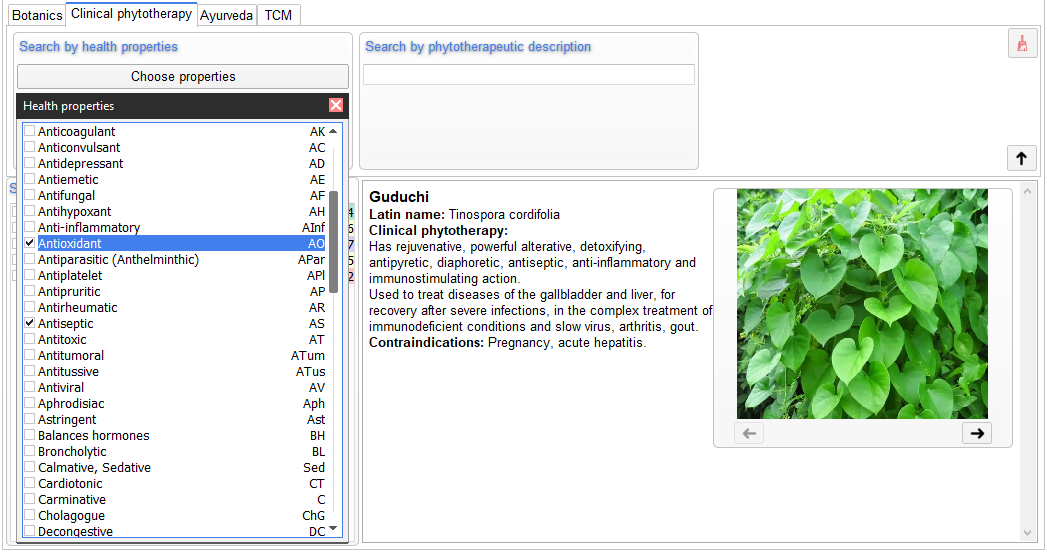
- Ayurveda tab
Here the properties of medicinal plants are described with classical Ayurvedic terms; the tab provides searching by such properties as: Dhatu, Rasa, Guna, Virya, etc.
The filter system allows you to sort the plants according to their qualities.
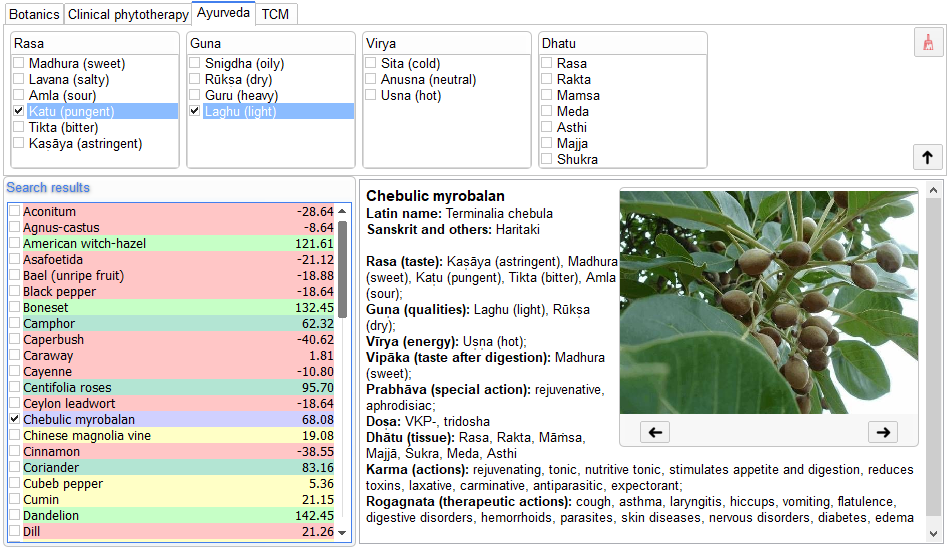
- TCM tab
In this tab the plants are described from the perspective of Traditional Chinese medicine.
There is a number of filters in the tab allowing you to search plants according to: taste per TCM, energy per TCM, TCM syndromes, a certain direction of TCM, TCM organ syndromes.
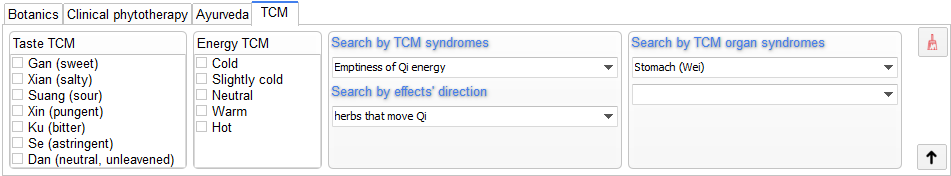
To reset the filters chosen before click "Clear filter".
When you click “Fold filter” (an arrow icon) the filter window would disappear and a list of previously selected filters come out.

Saving of the report
Report of the Herbal Encyclopedia expert extension includes the following:
- The chosen Nosology (-ies)- The list of the recommended products, ranged by the rating (the strength of action). There is also a detailed description of the methods of application and contraindications for each product with the option of editing. Choose the methods of usage that are optimal for each particular client.
- The “Note!” tab – general rules and recommendations on phyto procedures
Aroma Encyclopedia
The Aroma Encyclopedia software module allows you to solve the following tasks:
- Compilation of customized aroma compositions;
- Formation of the list of essential oils constitutionally suitable for a particular patient, ranking of essential oils taking into account the current functional state, calculation of the power of influence of each oil on a particular patient;
- Assessment of the effect of the aroma composition on the general condition of a patient with a graphic visualization of the power of influence, a value index and a text description;
- Search for oils by the specified parameters: botanical name, Latin name, foreign names, Sanskrit. Search by description of aroma, method of production, chemical composition, as well as search by medicinal properties, impact on the psycho-emotional state, application in cosmetology, search for the compatibility of aromas;
- Description of the preparation and application methods of essential oils;
- The possibility of choosing essential oils taking into account the nosological filter for specific diseases;
- The possibility to filter the list of oils by aroma notes: base, heart, top;
- The possibility to filter the list of oils by medicinal properties;
- Automatic report creation with a completed aroma composition.
To get started, go to the Recommendations tab - Aroma Encyclopedia. The module consists of the Rating and Encyclopedia tabs.
Rating tab
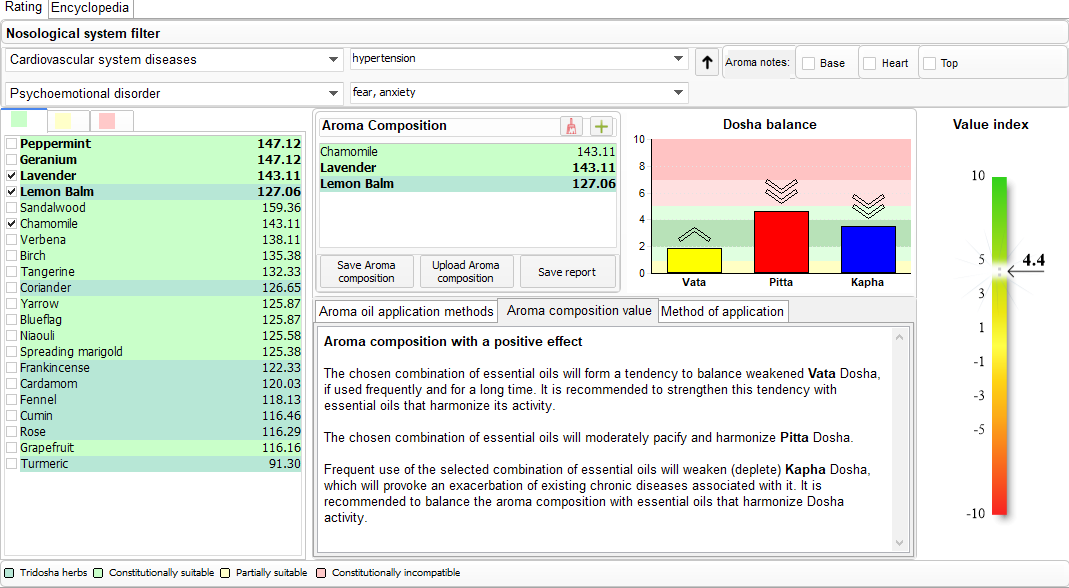
The Rating tab allows you to create a customized aroma composition taking into account various nosologies.
All oils are conditionally divided into three sub-tabs of different colors, the so-called aroma traffic light: Green, Yellow, Red.
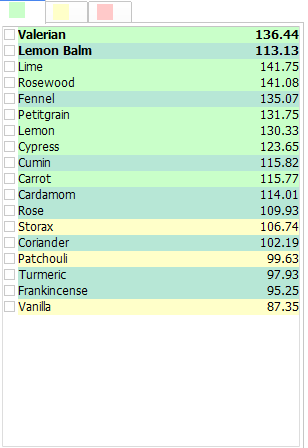
- The oils that are most effective for a particular patient, taking into account their constitutional features, fall under the sub-tab marked with a green icon.
- The oils that can be used for the patient, but it is recommended to use them together with the oils from the green sub-tab fall under the sub–tab marked with a yellow icon.
- The oils that are not recommended for this patient, which may worsen their condition fall under the sub–tab marked with a red icon.
Each oil has its own rating — a digital value on the right side. This is the potential effect of the oil on a particular patient. The higher the rating, the greater the value of the essential oil in terms of restoring human health.
Also, each oil has its own cutline. The cutline is a color representation of each essential oil, which reflects its effect on a patient, taking into account their constitutional profile:
- Tridosha
Oils with a harmonious and balanced effect (the so-called Tridosha oils or oils with a harmonious Yin-Yang balance), that are acting favorably on all regulatory systems (Dosha) positively. Generally, they have a very strong effect on the body.
- Constitutionally suitable
Constitutionally balanced oils are the ideal oils for the patient (taking into account their constitution). The list is formed individually for each patient after the VedaPulse assessment.
- Partly suitable
Partly constitutionally suitable – some properties of oils may enhance constitutionally related tendencies to the course of diseases, but collectively these properties of oils, when used in combination with other oils, will have a beneficial effect on the patient. The list is formed individually for each patient after the VedaPulse assessment.
- Constitutionally incompatible
They will increase the Dosha imbalance in a particular patient if used. The list is formed individually for each patient after the VedaPulse assessment.
For each category there is a conditional color description displayed in the cutline below the list. Regardless of the category, oils can fall into any of the lists (green, yellow, red).
The nosological system filter contains more than 250 pathological conditions. Filtration of oils according to the nosological principle allows a specialist to take into account both the constitutional and the properties of oils for the pathogenetic therapy of diseases. This provides a more optimal approach to the configuration of the aroma composition, taking into account the existing chronic pathology of a patient.
There is a possibility to choose two diseases at the same time – for example, hypertension and diabetes mellitus.
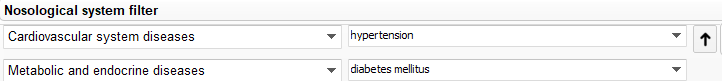
The program allows you to filter the essential oils depending on the aroma notes: base, heart and top.
When you click on the oil from the main list, the following information will be displayed in the Aroma oil application methods block: botanical name, Latin name, traditional and classical methods of application.
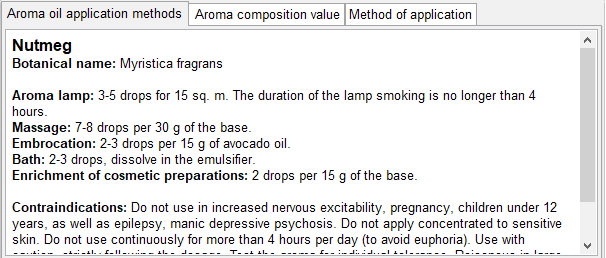
When the oil is ticked in the list, it is placed in a separate Aroma Composition block, where the specialist forms a list of oils for a patient (from any of the lists).
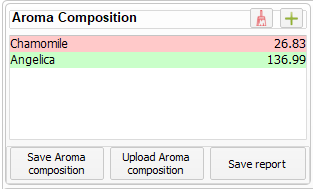
In the Method of application block, the specialist can add their own recommendations on the methods of application of oils and aroma compositions, or copy the method of application of one of the aroma oils, which will be common to all selected oils, and adjust it.
The Dosha Balance graph reflects the power of influence of the aroma composition on individual Dosha in the form of the arrows - power of influence.
The arrows pointing upwards indicate an increasing action, downwards – a decreasing one. There can be from one to three arrows or there can be none of them:
- 3 arrows – potent aroma composition
- 2 arrows – moderately acting
- 1 arrow – weak
- No arrow – neutral effect
On the index scale of the Composition value, the total utility of the aroma composition is displayed in the range from -10 to 10:
- From 5 to 10 – Aroma Composition with a pronounced positive effect
- From 3 to 5 – Aroma Composition with a positive effect
- From 1 to 3 – Aroma Composition with a weak positive effect
- From -1 to до -1 – Neutral effect of Aroma Composition
- From -1 to -3 – Aroma Composition with a weak negative effect
- From -3 to -5 – Aroma Composition with a negative effect
- From -5 to -10 – Aroma Composition with a pronounced negative effect
The variants of the influence of the aroma composition are described in text format taking into account the current person's constitution and reflect possible effects on the body. Should be clarified that it is necessary to consider individual characteristics of a person, their diseases and sensitivity to the ingredients of essential oils.
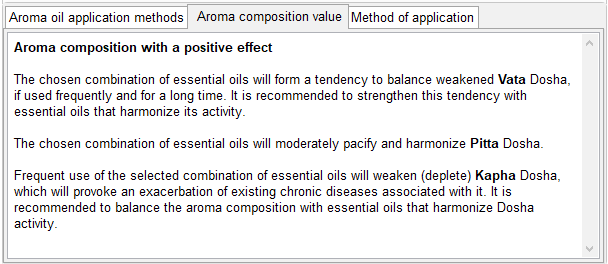
A generated composition can be saved by clicking on the Save aroma Composition button. It can be used later for another assessment using the Upload Aroma Composition button.
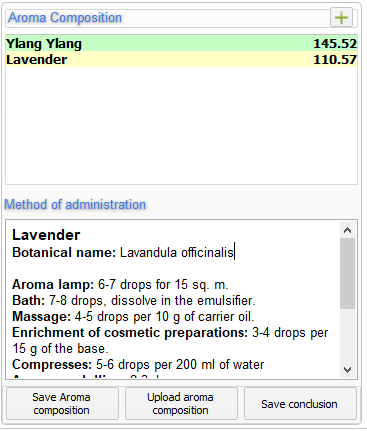
The Save report button allows you to save the generated aroma composition and information about its influence on a person's constitution to a separate file.
Encyclopedia Tab
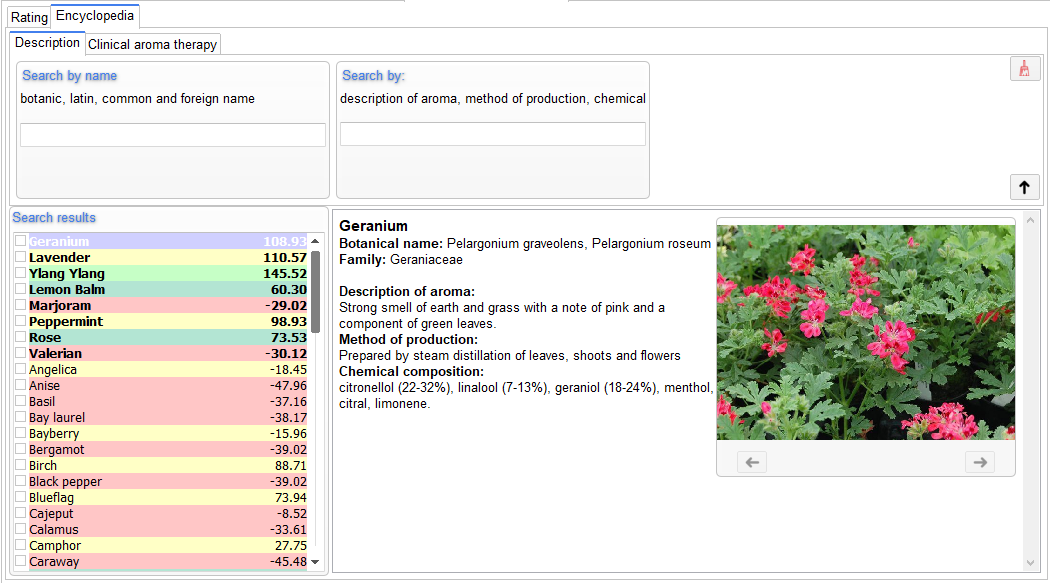
The Encyclopedia tab consists of two sub-tabs: Description and Clinical aroma therapy. It contains a multiparametric search and a filtering system based on the medicinal properties of essential oils.
For more convenience of working with the Herbal Encyclopedia and Aroma Encyclopedia modules, the function of Automatic search when entering has been added. The function allows you to see all possible options that meet the search criteria when searching after clicking on the Search button or immediately while typing (relevant for slow computers).
The Description sub-tab is devoted to the description of essential oils and includes: the name of the oil, the Latin name, the foreign name, as well as the ability to search for the plant according to the above items, the description of aroma, method of production and chemical composition.
The section contains: an illustration, a description of aroma, information about the methods of production essential oil, as well as parts of plants used to produce oils, the substances that make up the essential oil are indicated.
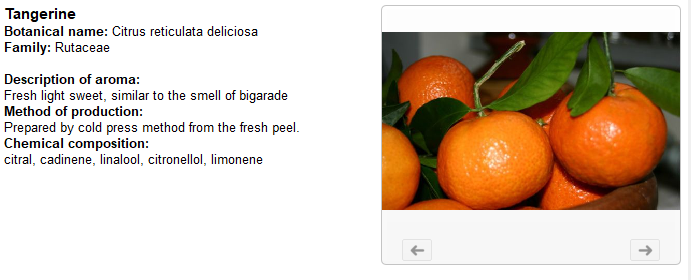
In this section you can search by two filters: Search by name (botanical, Latin, common and foreign names) and Search by description of aroma, method of production and chemical composition.
The Clinical aroma therapy sub-tab is devoted to the description of the application of essential oils in clinical aroma therapy.
There are two filters in this sub–tab: a search by medicinal properties, and a separate filter - a search by the impact on psycho-emotional state, application in cosmetology, compatibility of aromas. The main feature of this sub–tab is the ability to search for essential oil by its medicinal properties. The list contains more than 60 classic properties of essential oils (hepatoprotection, aphrodisiac, adaptogen, etc.).
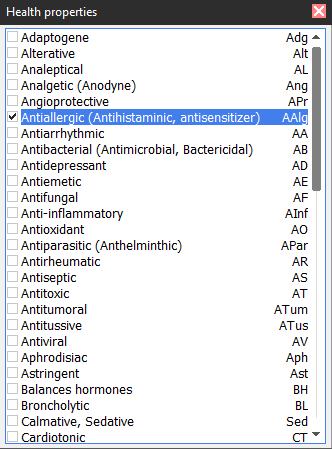
Supplements Encyclopedia
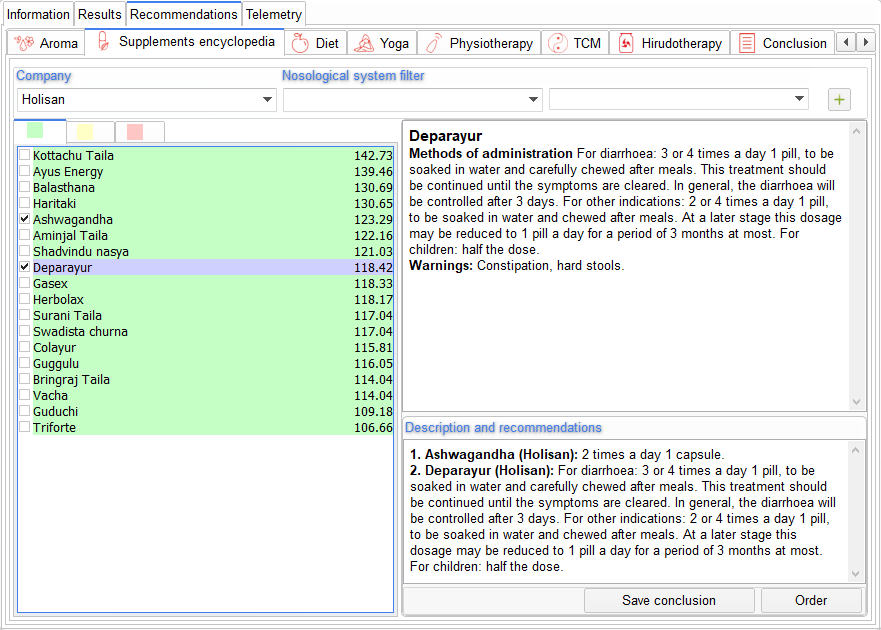
Supplements Encyclopedia provides an extended description of each supplement, including methods of application and contraindications.
All the supplements get sorted into three lists according to suitability for the patient:
• The green list – an ideal suitability — supplements fully compensating the imbalance of Doshas present in the
patient.
• The yellow list – optimal suitability — supplements appropriate for the dominating Dosha only, without taking
into account duality of the constitution.
• The red list – contraindicated supplements — usage of these supplements would only worsen the imbalance of
Doshas.
Each supplement is rated in the list by certain number in CU. The higher the rating number of the supplement the more influence it has in terms of restoration of the balance.
There is a system-nosological filter provided in the module that allows to choose up to 2 nosological groups of disorders at once (press “+” to add another group). Once nosological groups are chosen all the suitable supplements in the list get highlighted in bold type.
When clicking the name of the supplement in the list, you would see its description displayed in the field on the right.
You can create a list of drugs you choose by ticking their names in the list, thus adding the drugs to the "Description and recommendations" field. The list can be formed of different drugs provided by different companies. After forming the list, you can save the report that would include a description of each drug by clicking "Save report".
Also, you can register an online order based on the generated list. To do this, click the "Order" button. In the window appeared you specify the data on the Specialist and the Patient, check the Order data, and then click "Send".
List of the companies whose products are included in the module "Supplements Encyclopedia" in the "VedaPulse” program.
Diet
Rating Tab
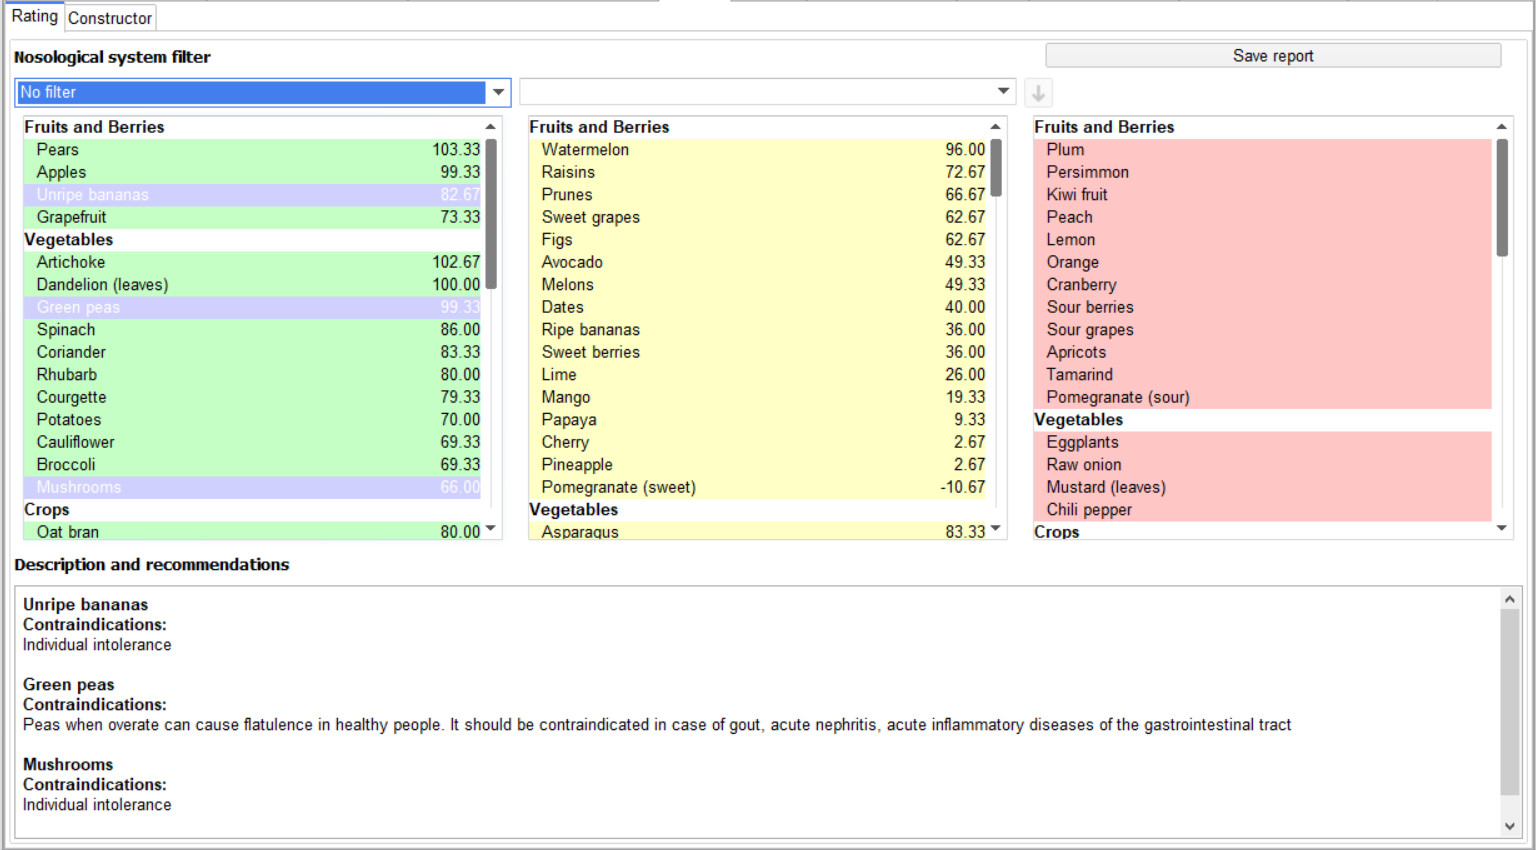
The Rating tab is designed to compile detailed recommendations on a constitutionally balanced diet. All products are divided into three columns: perfect match, optimal match, not recommended.
Select the products by clicking on them with the Ctrl or Shift button pressed (in this case, the products will also be marked in the lists in the Constructor tab).
Descriptions and recommendations of the selected products will appear in the lower text field.
A product table can be saved to a separate file by clicking on the Save report button.
Constructor Tab
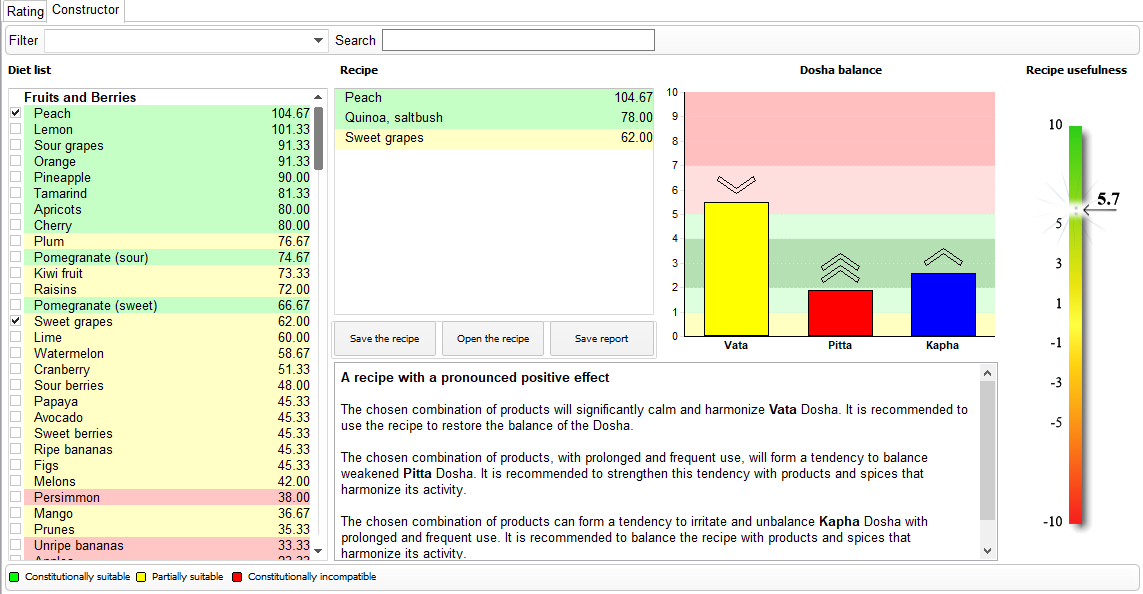
The Constructor tab allows you to evaluate the influence of a complete recipe on a person’s constitution.
Select products by marking them in the Rating tab or in the Product list. Using the
Filter you can sort products by categories, and the Search field allows you to find desired product in the list.
The selected products will be placed in the Recipe field.
The Dosha Balance graph reflects the forces of the culinary recipe's influence on individual Dosha in the form of the arrows - Effect on Dosha.
The arrows pointing upwards indicate an increasing action, downwards – a decreasing one. There can be from one to three arrows or there can be none of them:
On the index scale of the Recipe value, the total utility of the recipe is displayed in the range from -10 to 10:
From 5 to 10 – Recipe with a pronounced positive effect
From 3 to 5 – Recipe with a positive effect
From 1 to 3 – Recipe with a weak positive effect
From -1 to до -1 – Recipe with a neutral effect
From -1 to -3 – Recipe with a weak negative effect
From -3 to -5 – Recipe with a negative effect
From -5 to -10 – Recipe with a pronounced negative effect
The variants of the recipe effect are described taking into account current person’s constitution and reflect possible consequences. It should be clarified that it is necessary to consider individual characteristics of a person, their sensitivity to the ingredients of a recipe. The general trends of the influence of food products on typical constitutional types are calculated.
A generated recipe can be saved by clicking on the Save recipe button. It can be used later for another assessment using the Open the recipe button.
The Save report button allows you to save the generated recipe and information about its influence on a person’s constitution to a separate file.Yoga
Yoga Therapy software module allows you to determine the most suitable Yoga Composition for a patient and create an individual program of yoga therapy.
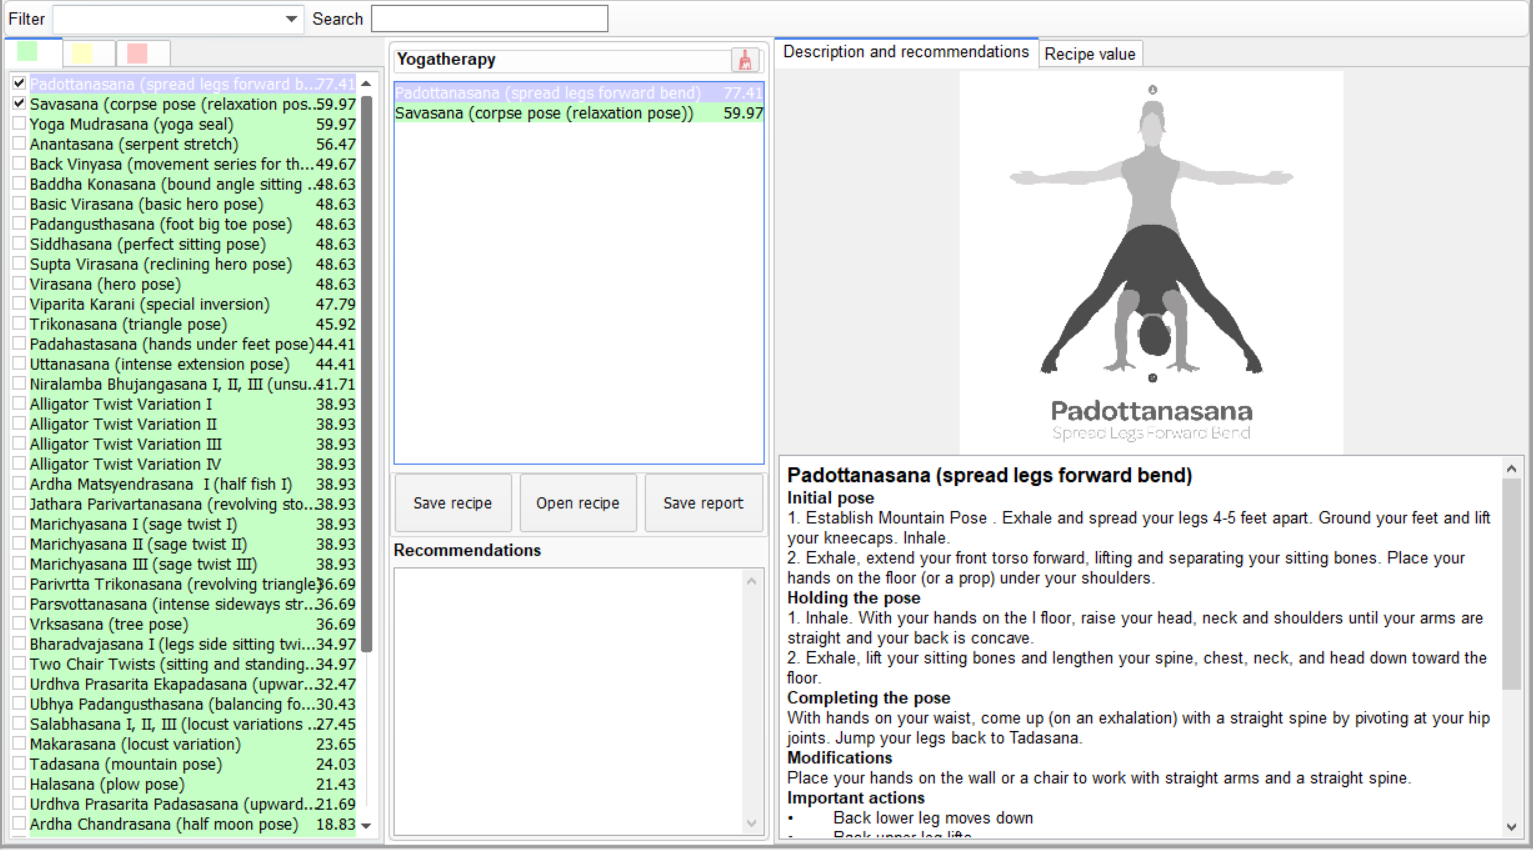
All yoga compositions are conditionally divided into three lists of different colors: Green, Yellow, Red.
- Green list includes asanas that are most effective for this patient, taking into account their constitutional features.
- Yellow list contains asanas that have a partial constitutional correspondence, which can be practiced by this patient, taking into account their usefulness.
- Red List – asanas that are constitutionally inappropriate, which can only be practiced in a constitutionally balanced complex.
Rating of each asana is indicated opposite in the list in conventional units. It shows the most suitable asanas.
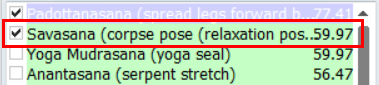
When asana is ticked in the list, it is placed in a separate Yogatherapy block, where a specialist forms a yoga therapy recipe for a patient (from any of the lists).
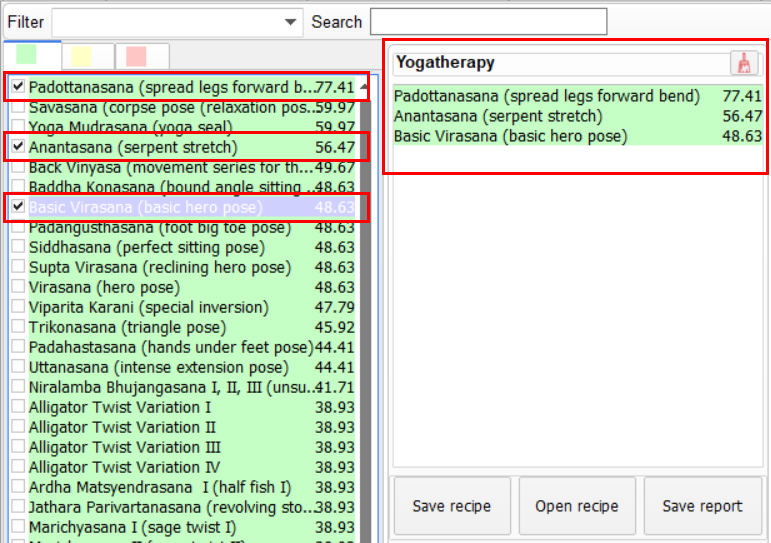
With the help of asana Filter, you can filter them by the pose type, and Search helps to find asana by its name.
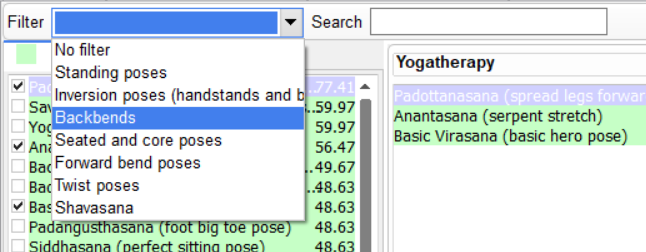
There are two ways to remove asana from the recipe: uncheck asana in the traffic light list, or select it in the recipe (by left-clicking), and then open the context menu by right-clicking on asana, and select the Delete option.
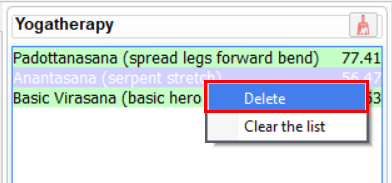
You can empty the recipe using the
![]() icon or by clicking Clear the List in the context menu.
icon or by clicking Clear the List in the context menu.
The generated yoga therapeutic recipe can be saved in the program memory. To do this, click on Save recipe button and give a name to a new recipe, for example, "Yoga therapy for GIT disorders".
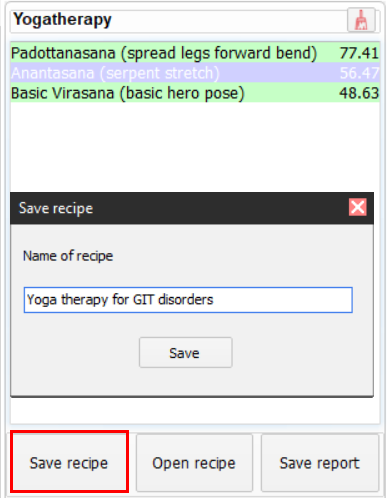
Subsequently, you can use the saved recipe for this or another patient by downloading it from the Open Recipe pop-up menu.
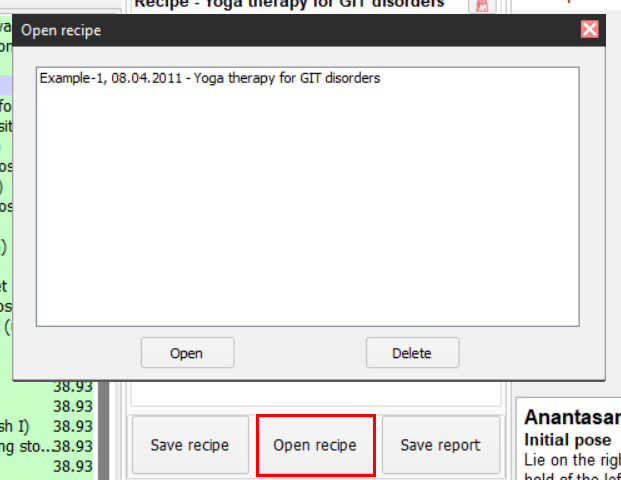
In the same window, you can delete unnecessary recipes by clicking on the Delete button.
The Description and Recommendations sub-tab contains a detailed description of the step-by-step deployment of asana with an image and text instructions for a specialist and a patient. They include:
- Initial pose;
- Holding the pose;
- Completing the pose;
- Modifications;
- Important actions that should not be missed when performing asanas;
- Dosha comments (personal recommendations);
- General precautions for asanas;
- Pranayama instructions.
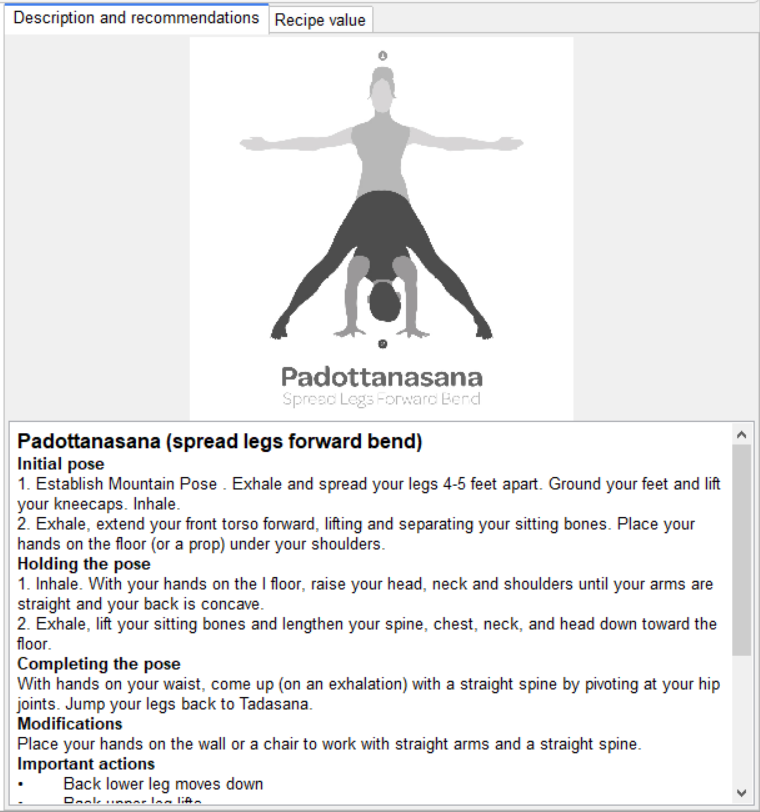
Please note that Yoga contains personal recommendations describing the specifics of practicing with a particular human constitution. They are reflected in the exercise description window.
The Recipe value sub-tab allows you to evaluate the effect of a yoga therapy recipe on a patient in general.
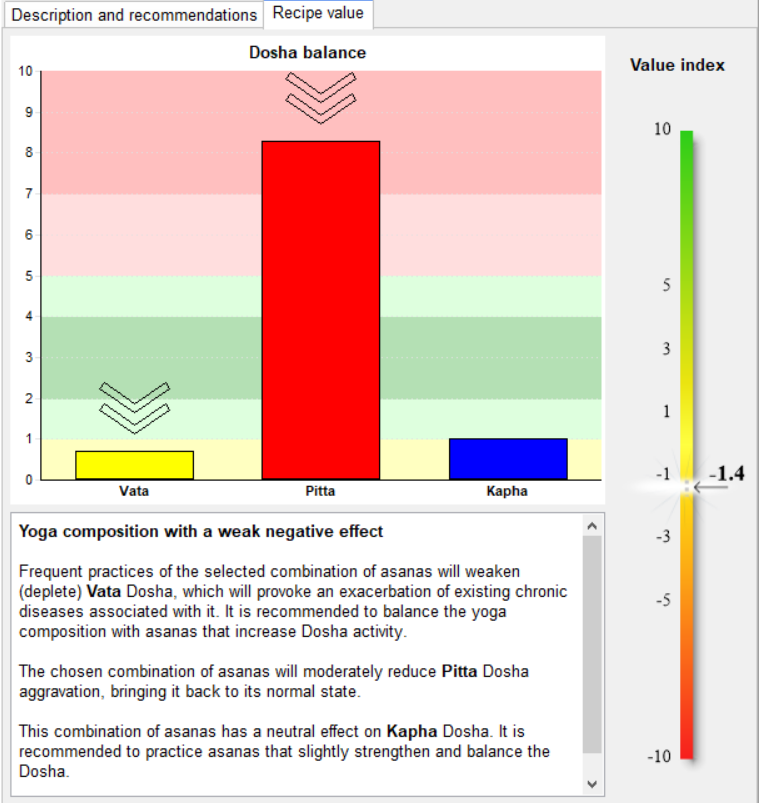
Dosha balance graph reflects the forces of asanas composition effect on individual Doshas in the form of arrows – power of influence.
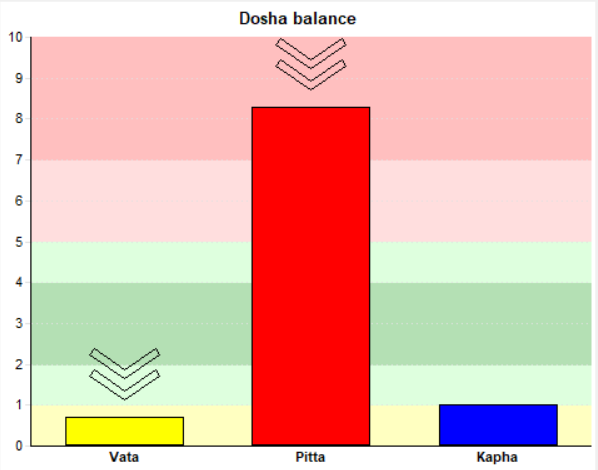
The arrows pointing upwards indicate an increasing action, downwards – a decreasing one.
There can be from one to three arrows or there can be none of them:
- 3 arrows — potent recipe
- 2 arrows – moderately acting
- 1 arrow – weak
- No arrow – neutral action
The Value index scale shows the total usefulness of a yoga therapy recipe in the range from -10 to 10:
From 10 to 5 – Yoga composition with a pronounced positive effect
From 5 to 3 – Yoga composition with a positive effect. Balancing effect on Doshas
From 3 to 1 – Yoga composition with a weak positive effect. No pronounced therapeutic effect
From 1 to -1 Yoga composition with a neutral action
From -1 to -3 – Yoga composition with a weak negative effect
From -3 to -5 – Yoga composition with a negative effect. Negative impact. Not recommended for use
From -5 to -10 – Yoga composition with a pronounced negative effect. Significant unbalancing effect even with short-term use. Highly not recommended for use.
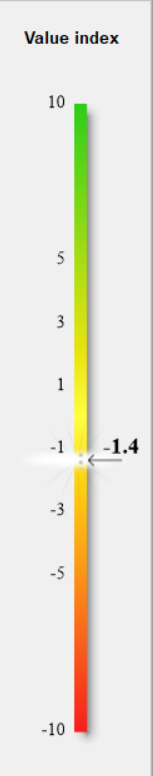
The variants of asana influence are described in text format taking into account current person’s constitution and reflect possible effects on the body. Should be clarified that it is necessary to consider individual characteristics of a person and existing diseases.
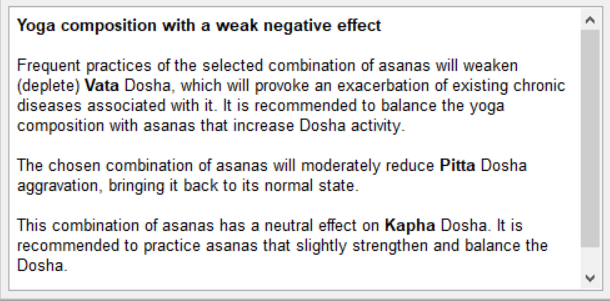
The Recommendations unit is intended for adding individual specialist’s comments for a patient. The text from this field is stored in the program memory and falls into report.
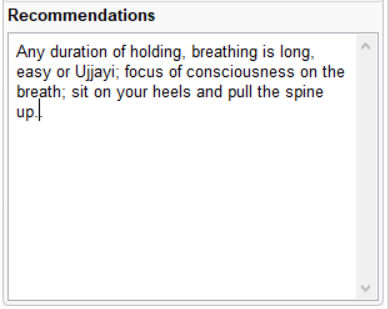
When asanas are selected, you can save report by clicking on the corresponding button.
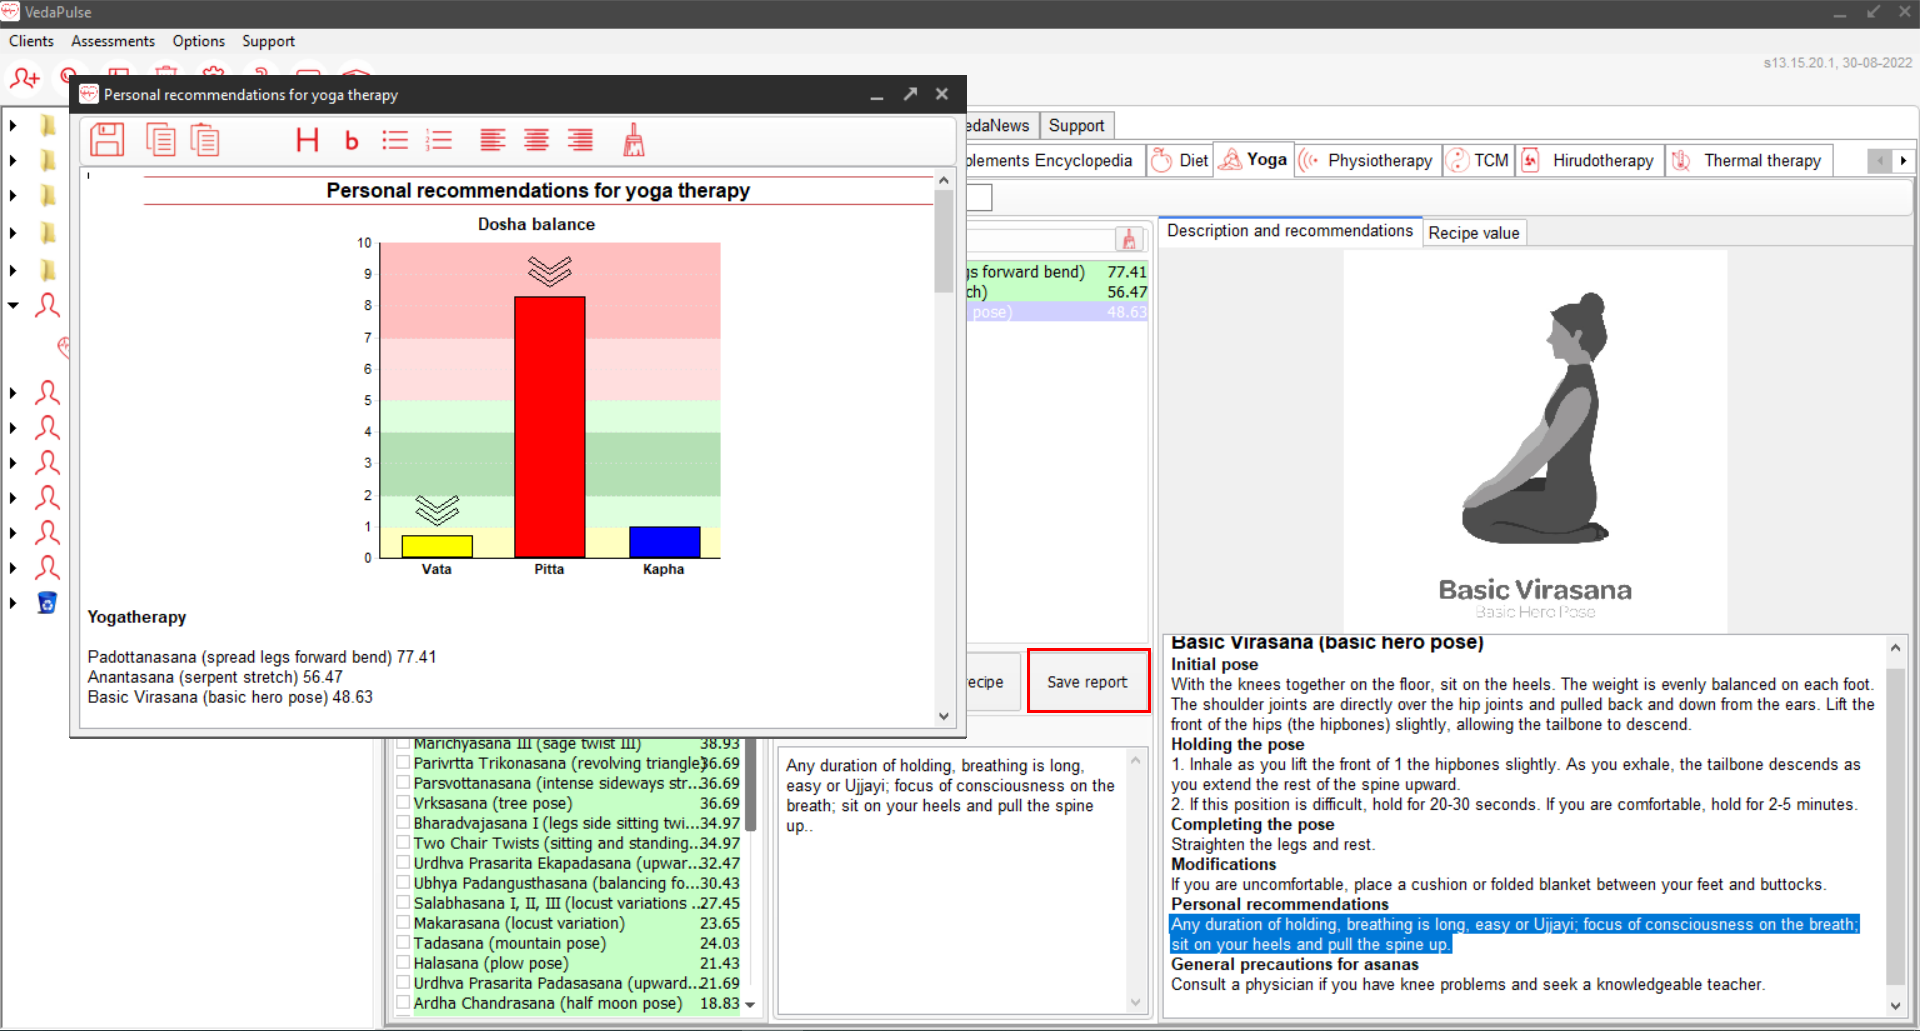
TCM
Acupuncture
Open assessment (1). Go the Recommendations section (2). Open TCM tab (3). After that choose Acupuncture tab (4).
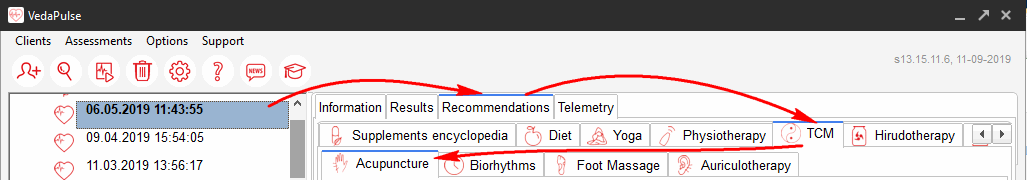
Select Zhen or Jiu type of the Chinese therapy.

Specify date and time of the first session.
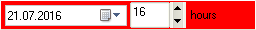
Select disease or normalization of the functional state from the drop-down nosological filter menu.
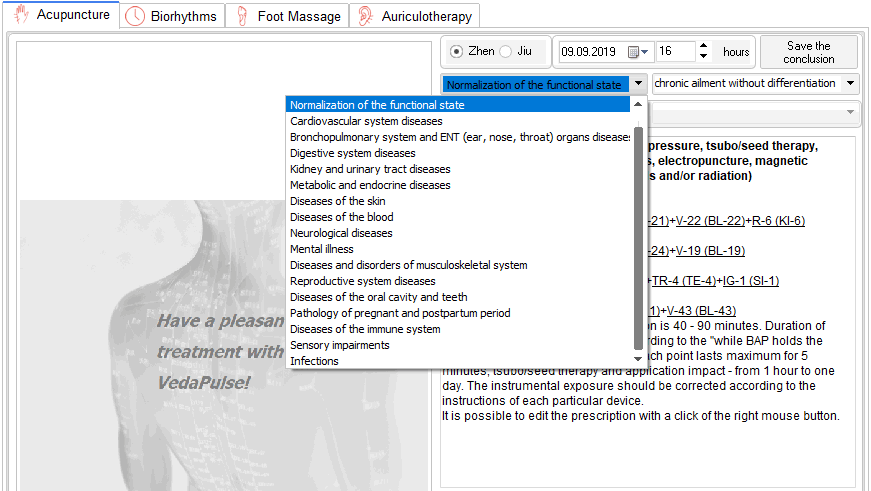
Activate a point (2) by clicking on it in the prescription (1).
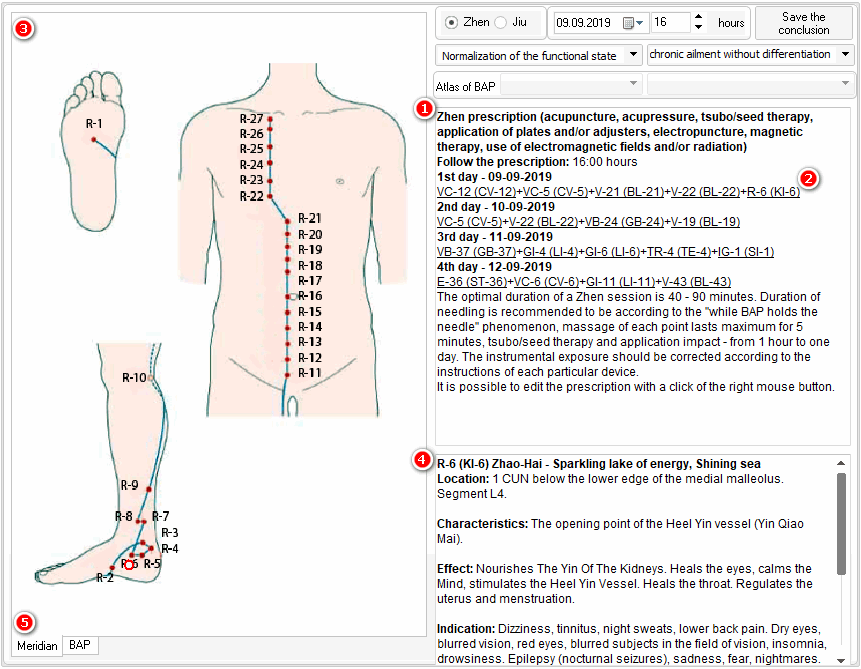
Massage
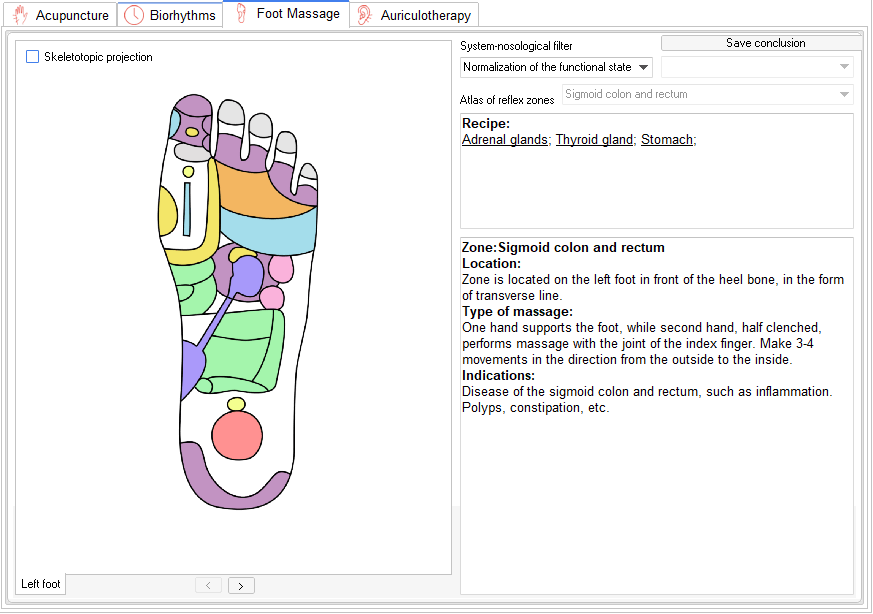
The tab Massage is designed to generate recommendations for conducting Wellness massage of reflex zones of the feet. After the assessment, the program automatically creates a recipe that includes:
- A list of reflex zones that need massaging.
- a description of the location of the zones and method of massage.
- a visual illustration of the foot with dedicated zones.
Biorhythms
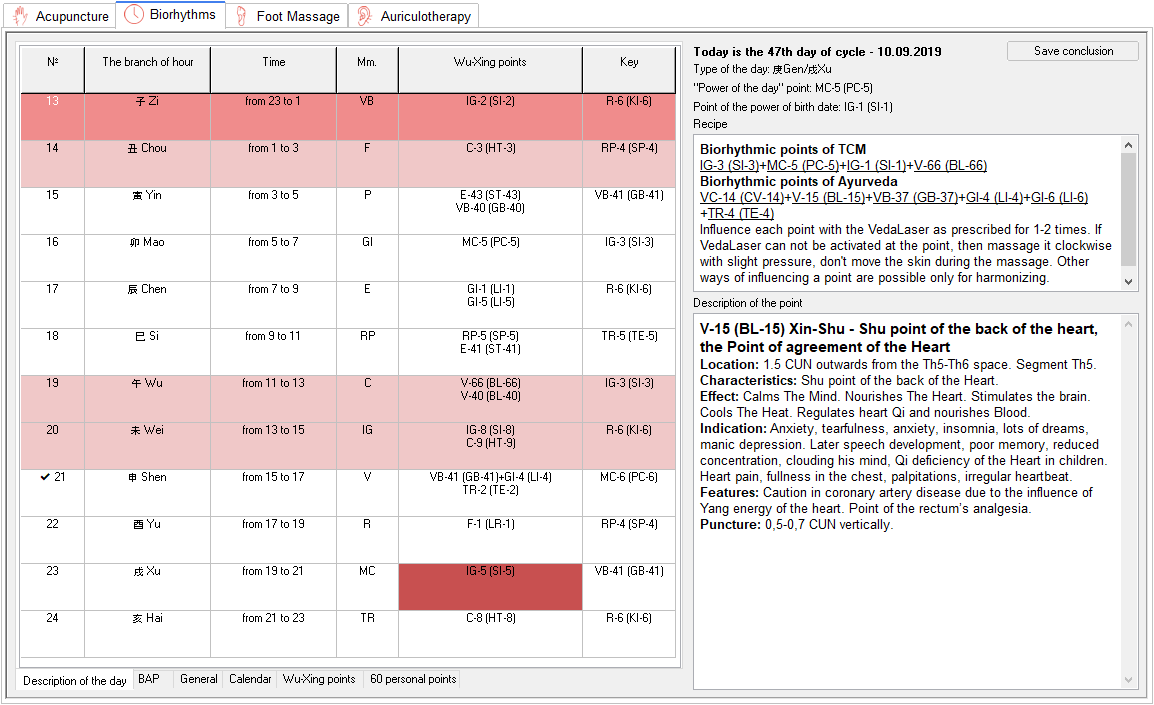
This application generates a personal calendar of effect to biologically active points, lights the preferable
points and shows the detailed explanation on effect.
Read more...
Auriсulotherapy
Auriculotherapy can be found in the TCM tab of the Recommendations section.
Then you open Auriculotherapy module, run a test to identify the “master ear”, to which the "master
prescription" of the first day will be applied. To start the test, please click on the highlighted area.
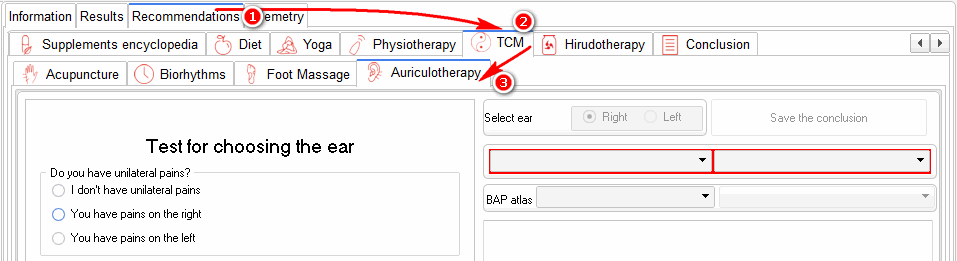
This test includes several variable steps. If you or your client has unilateral pain, painful side should be chosen. When you select the painful side, the test is finished and you can proceed to the nosological filter.
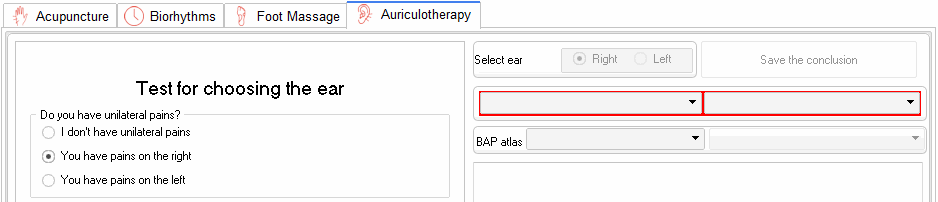
If no unilateral pain is identified, 3 more questions will be asked. After answering all the questions, master ear is chosen automatically and you can start working with the nosological filter (1 and 2).

You can choose either "Recovery of the functional state" or specific nosological group (1). Next, choose a specific disease in the nosological group (2).
Prescription is displayed for 2 days and consists of 2 parts.
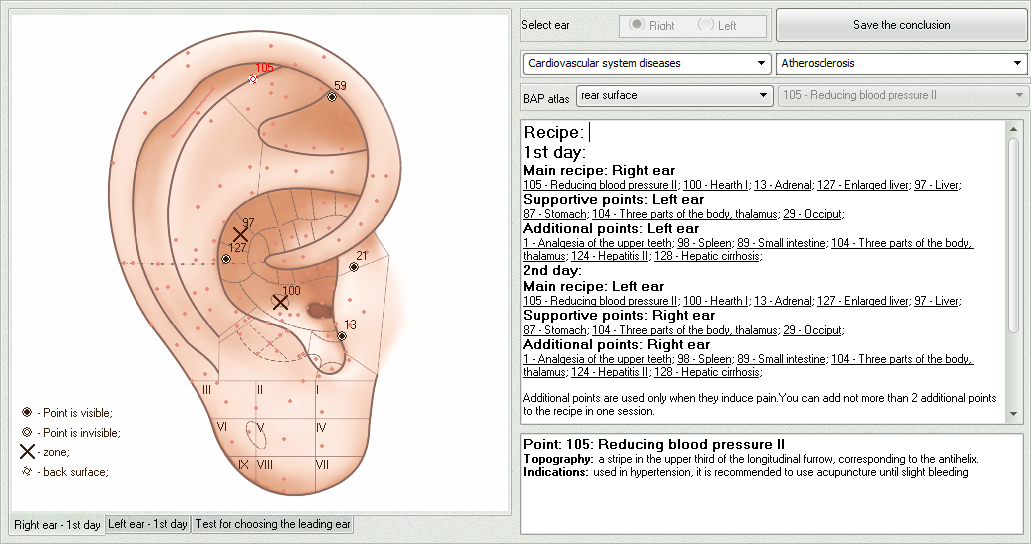
Prescription is aimed at correcting the pathological condition. Supporting points, located on the opposite ear, provide correction according to the patient’s constitution (Vata, Pitta, Kapha) and energy distribution in the channels according to TCM.
It is recommended to use the prescription for 4 days. The first and third sessions should be preformed according to the "Day 1" prescription, and the second and fourth sessions – according to the "Day 2" receipt. Further, if necessary, repeated assessment can be conducted to correct the variable part of the prescription.
Graphic prescription is interactive - by clicking on a point (1), you can see its description at the bottom of the window (2). Area of the auricle and selected point are also highlighted (3).
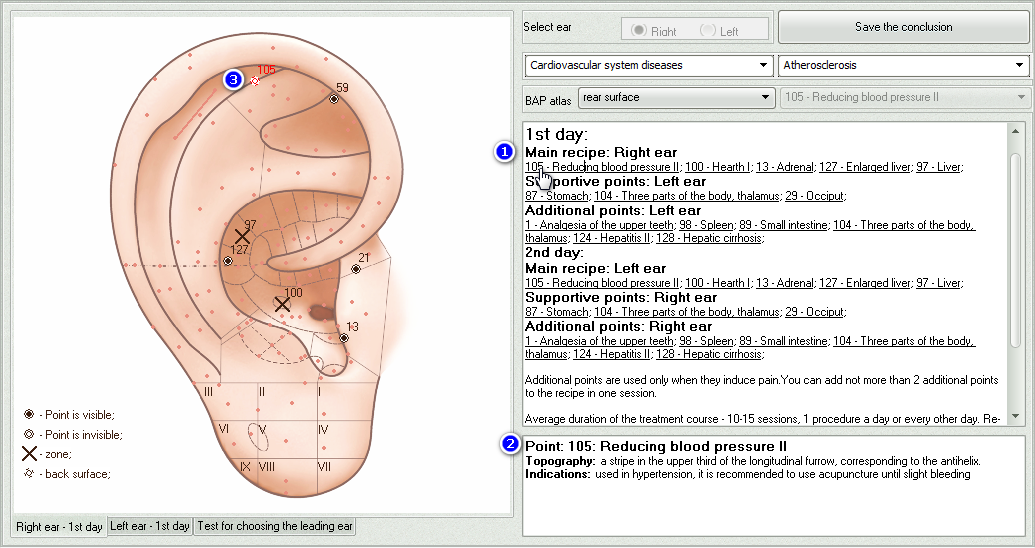
There is a “Save report” button available in the software.
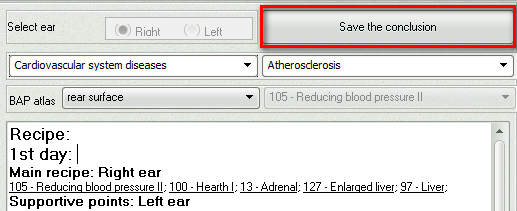
Expert extension has the BAP atlas, which describes 128 points of the ear auricle. Points can be found in the anatomic zone (1) of the ear or by their numbers (2).
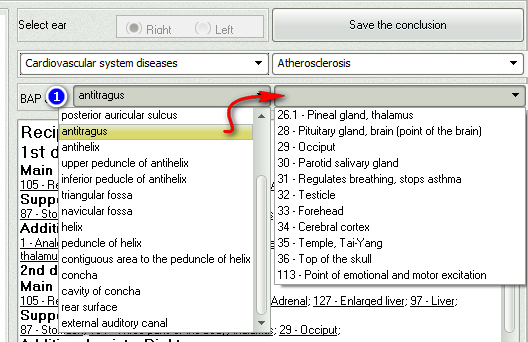
Some points have several locations. Thus, the point 72 is presented in six locations. When searching by number, the software will automatically offer you to choose from available options. When looking for a point by the anatomic area of the auricle, you will see all points located in this area and the selected area of the auricle will be highlighted.
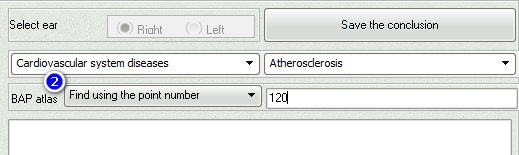
Physiotherapy
EHF
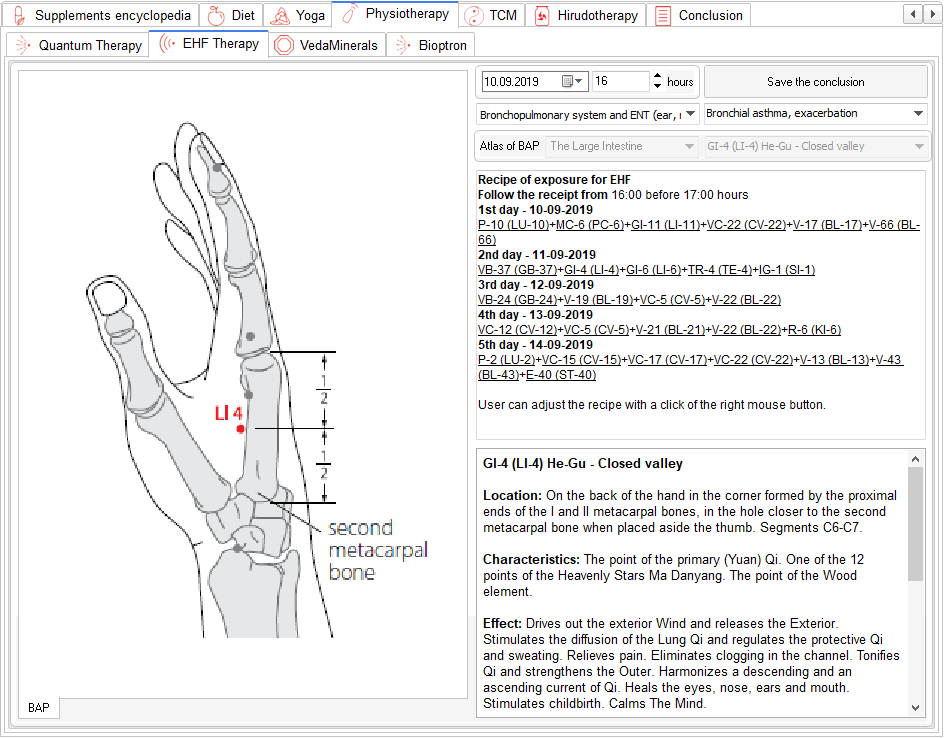
The tab helps to create the 5-day prescription of EHF-therapy with detailed description of points and method.
Read more...
Quantum Therapy
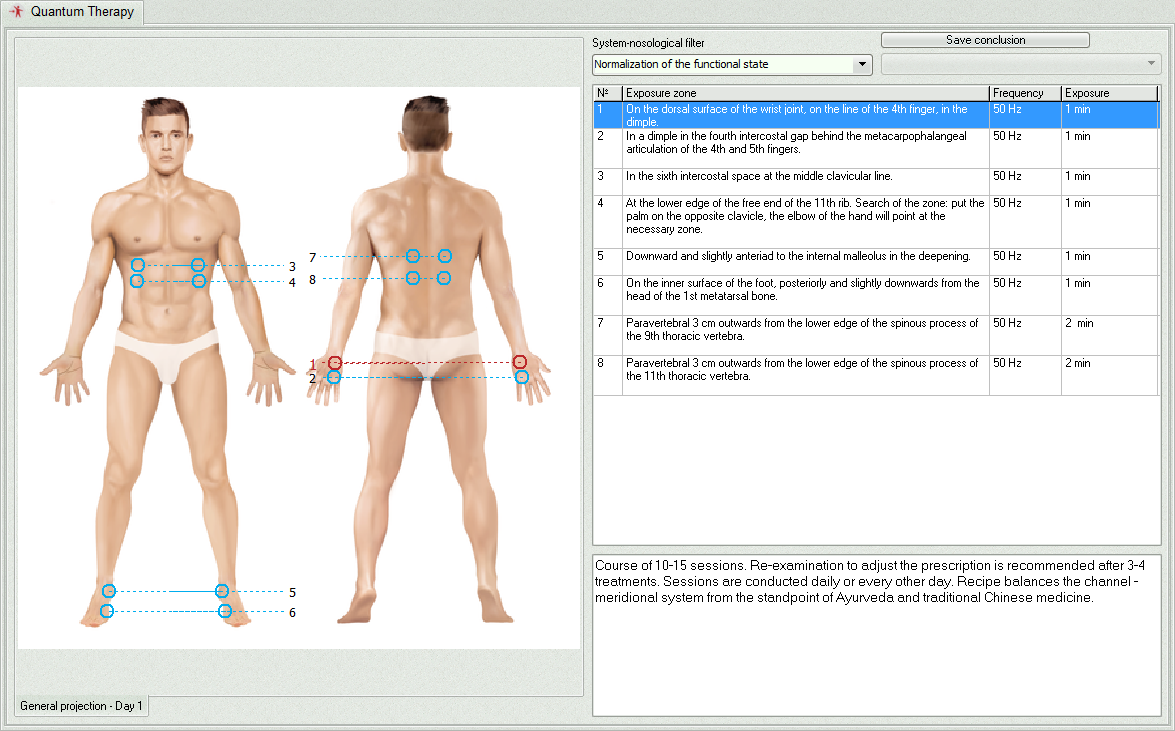
Expert extension Quantum Therapy is designed for professionals working in the field of traditional
(complementary, integrative) medicine. It allows creating individual physiotherapeutic recommendations for the
quantum treatment based on the VedaPulse assessment.
Read more...
VedaMinerals

Hirudotherapy
Hirudotherapy is located in the Recommendations section.
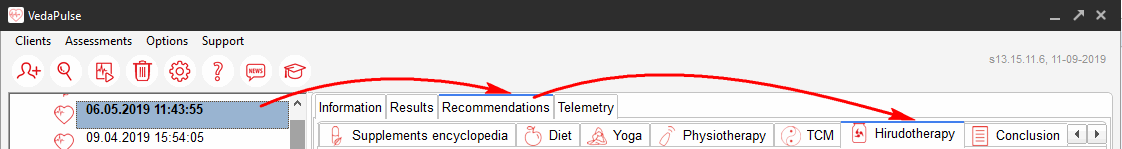
To form a hirudotherapeutic prescription, set up a system-nosological filter. Choose a classification of diseases. Then select the disease.
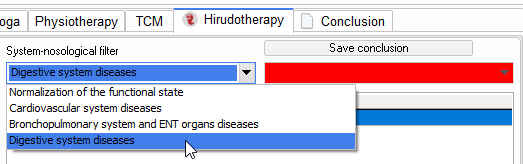
After choosing the classification and disease, you will see the Prescription.
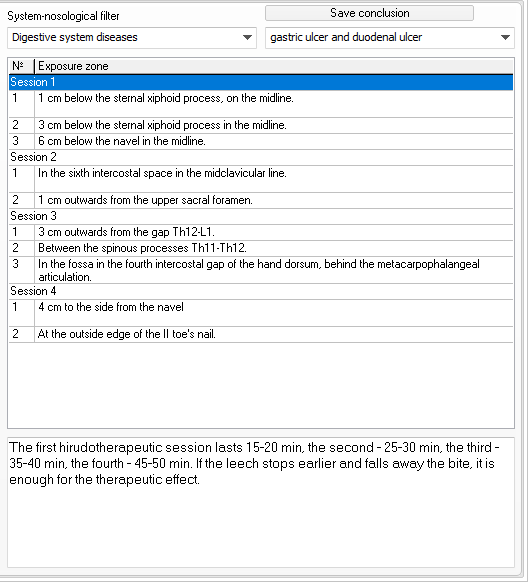
Click on the recipe lines to highlight the red areas where the leech is prescribed to be placed, read the comment under the recipe.
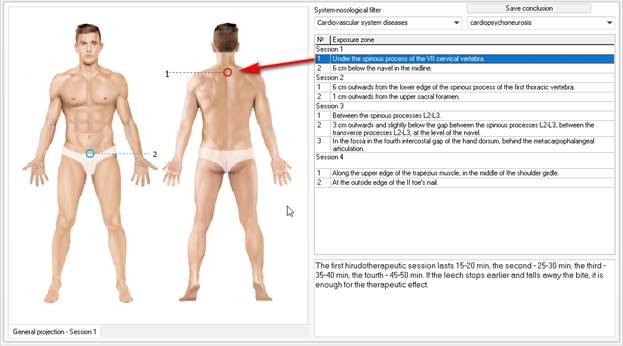
To save the report in the format of a text document, click Save report, specify the save location and click Save.
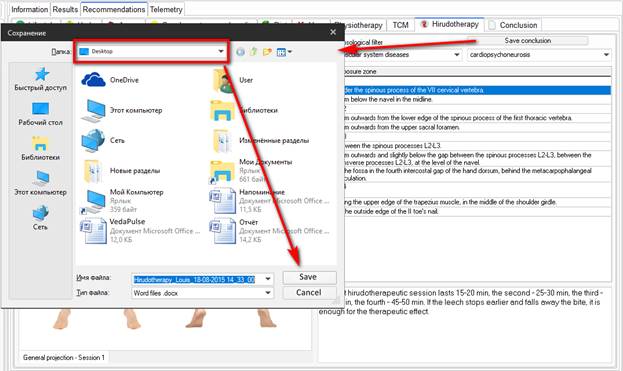
Thermal therapy
Software module ‘Thermal therapy’ is designed to provide individual recommendations on the optimal temperature and humidity mode (comfort zone) and the mode of steaming in a steaming room, based on the current psychophysiological state of a person and his constitutional features.
You can find the module in the ‘Recommendations’ tab in the main menu. The module contains two sections:
- ‘Temperature and humidity mode’
- ‘Steaming mode’
‘Temperature and humidity mode’
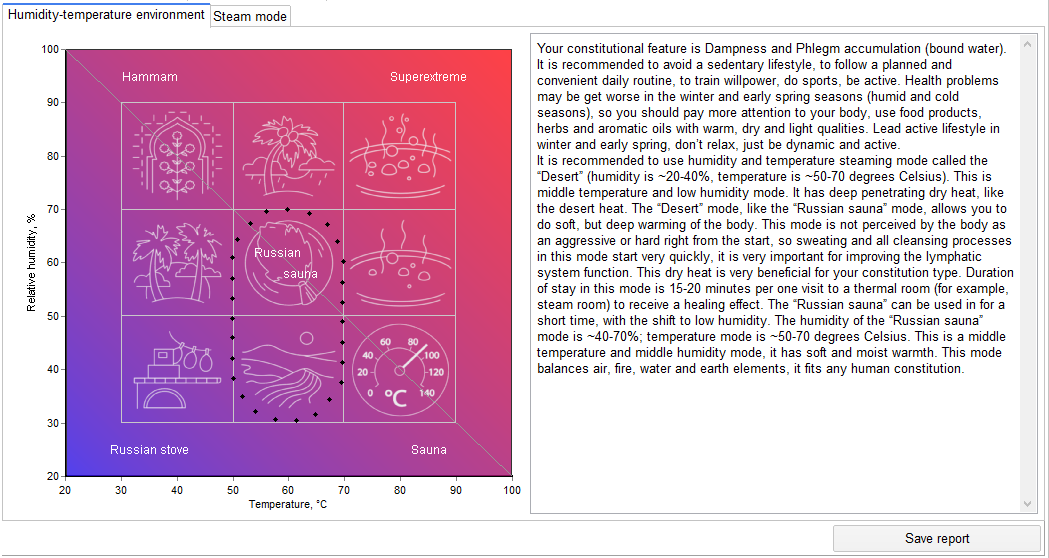
For choosing the optimal temperature and humidity mode, or ‘comfort zone’, there are 9 modes presented in the two-axis plane (X – temperature axis, Y- relative humidity axis) - each mode represents different combinations of humidity and temperature as well as a ‘Balanced’ mode with the sum of humidity and temperature close to 120.
Each mode has its own name, reflecting the nature of the environment you get with the mode.
The ranges of 9 modes are defined as follows:
Russian stove (30-50 °C, 20-40%)
Desert (50-70 °C, 20-40%)
Sauna (70-90 °C and higher, 20-40%)
Subtropics (30-50 °C, 40-70%)
Russian sauna (50-70 °C, 40-70%)
Extreme (70-90 °C and higher, 40-70%)
Hammam (30-50 °C, 70-90%)
Tropics (50-70 °C, 70-90%)
Superextreme (70-90 °C and higher 70-90%).
When hovering the cursor over any mode, the section would get selected and a help-window would appear, containing the characteristics and a brief description of the selected type of a steaming room or a mode.
In accordance with the type of constitution of a person identified by pulse diagnosis, one or more optimal ranges of humidity and temperature would get selected with the boundaries highlighted by points.
Thus, the selected temperature and humidity mode helps to eliminate the imbalances detected during the pulse diagnosis in the best way, as well as being the most comfortable for the patient. At the same time, you get recommendations on the duration of the exposure to different temperature and humidity modes.
‘Steaming mode’
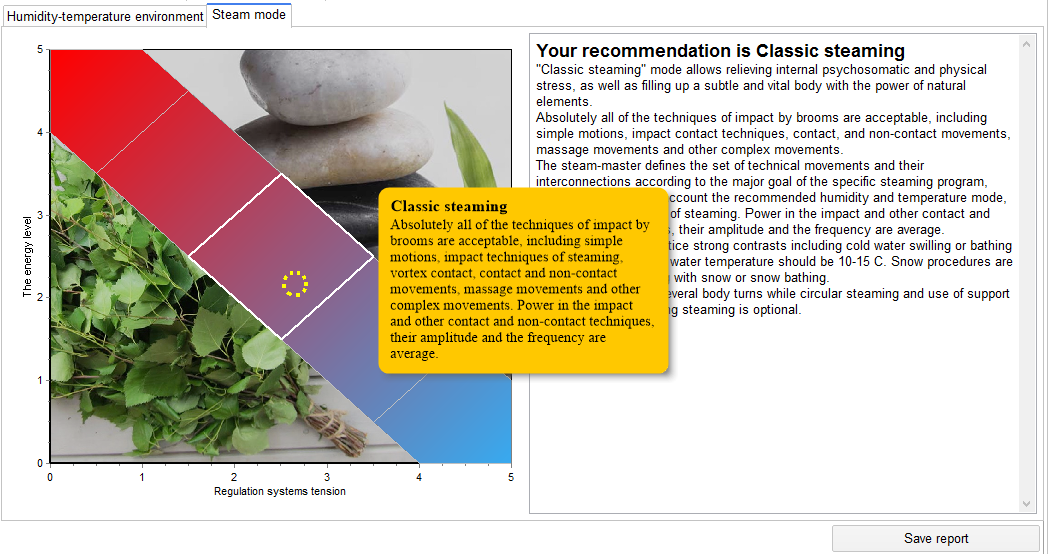
For choosing the optimal steaming mode, there are 5 zones allocated in a two-axis plane (X axis – tension of the regulation systems, Y axis - level of vital energy) represented by different combinations of regulation systems indicators and the level of vital energy. The point corresponding to the patient’s condition (highlighted in a circle) falls into one of these zones.
Each zone corresponds to a certain steaming mode with the name, reflecting the nature of the steaming chosen:
- ‘Intensive steaming’
- ‘Active steaming’
- ‘Classic steaming’
- ‘Energy balancing steaming’
- 'Energy restoring steaming’
When hovering the cursor over any mode, a help-window would appear, containing the characteristics and a brief description of the steaming mode.
The recommendations offer a variety of brooming techniques, including simple movements, impact techniques, vortex movements, contact, non-contact, massaging and other complex movements, as well as their frequency, amplitude and the force of impact. In addition, recommendations on the choice of contrast procedures are given.
Report
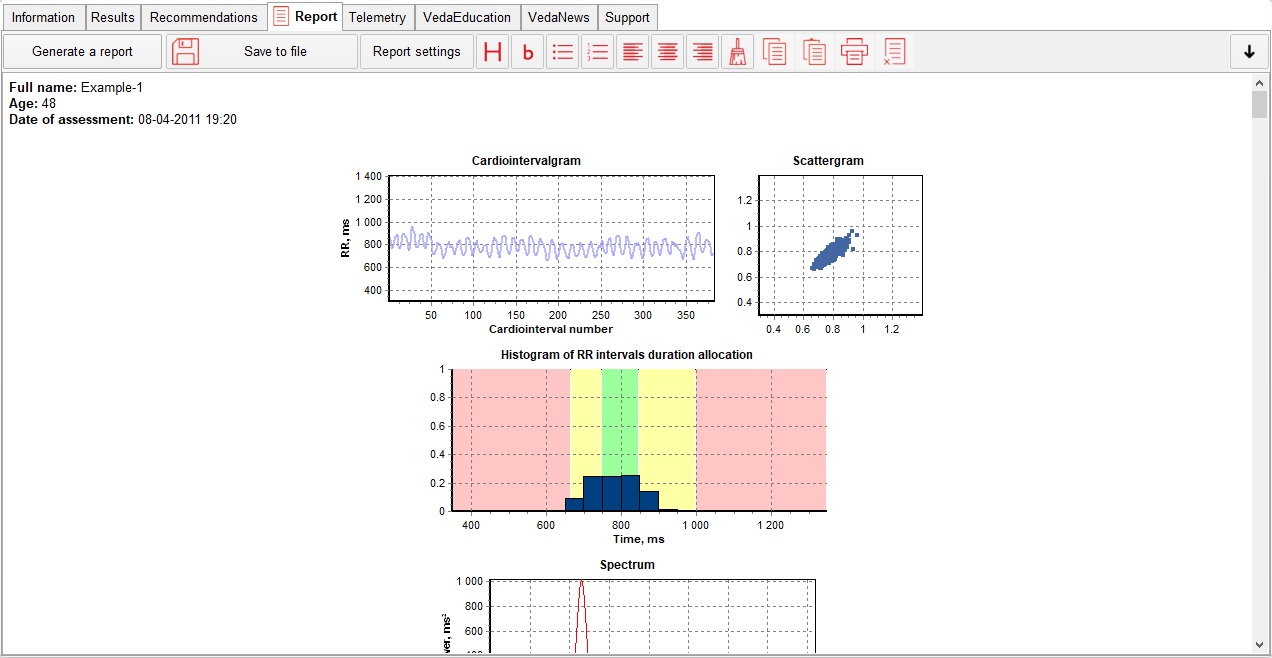
Tab “Report” is created for generating recommendation file.
Also it’s possible to add modules in a report one by one by pressing appropriate buttons. Press ↓ to open button menu. Every button has a help window which appears when you place a cursor on it.
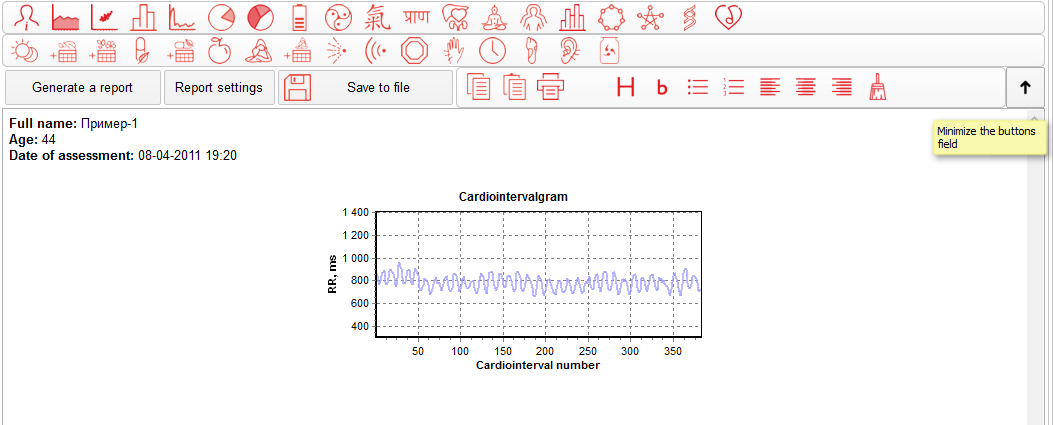
You can add in a Report information about patient and copy information from tabs which are needed in expert’s opinion by pressing appropriate buttons.
When you creates Report file you can use key combination «CTRL+C» to copy, «CTRL+X» to cut and «CTRL+V» to paste. Final version of the report can be saved to pdf-file or as a Word/RTF file. Also report can be send to a patient by using a tab “Telemetry”.
Report in the expert extensions
For editing and saving the report in the expert extensions, presented in the Recommendation tab, click “Safe the report”.
After this, there will appear a window with the following icons:
- Save the file - PDF, DOCX and RTF formats- Copy selected fragment to clickboard
- Paste from clickboard
- H icon – Highlight text as Header
- b icon – Highlight text in bold
- Bulleted list
- Numbered list
- Clear formating
Telemetry
The Telemetry software module is designed for:
- establishing a client-specialist distant communication — receiving assessments results from the VedaPulse Home software and sending recommendations from the VedaPulse Professional software;
- creating a distant communication between two specialists — sending assessments between two VedaPulse Professional software.
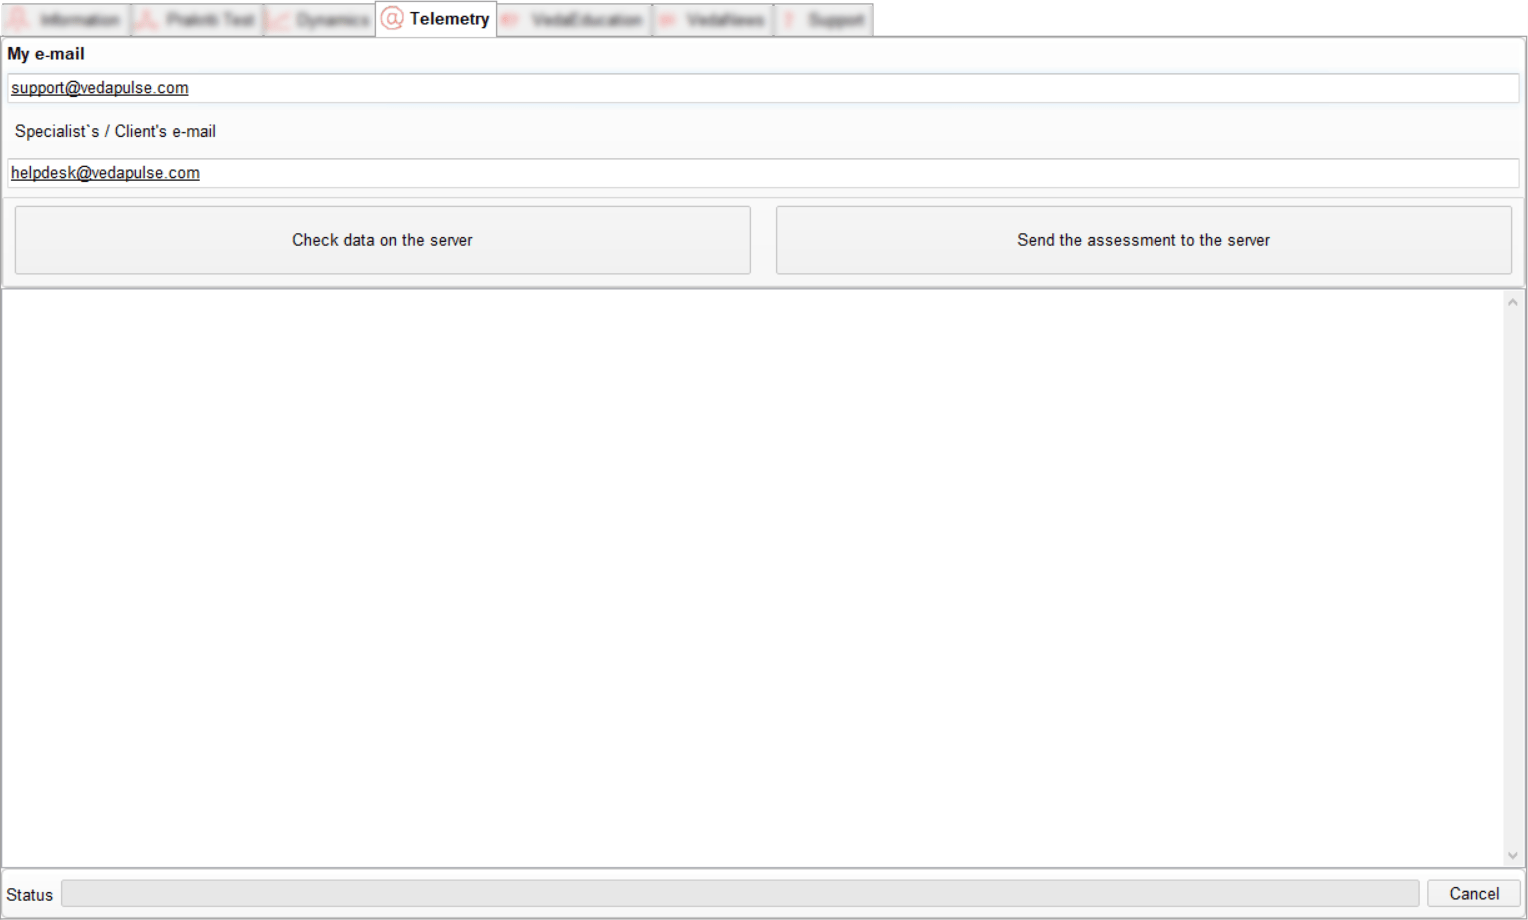
Data exchange between VedaPulse Professional and VedaPulse Home
To send an assessment to a specialist from the VedaPulse Home software, the client needs go to the Expert consultation tab.
Fill in the fields:
- My e-mail
- Specialist’s e-mail
Check the box next to the assessment that will be sent to the specialist.
Press the button Send the assessment to the server and wait for the process to complete.
To receive the assessment in the VedaPulse Professional from the VedaPulse Home, the specialist needs to go to the Telemetry tab.
Fill in the fields:
- My e-mail
- Specialist’s / Client’s e-mail
Press the button Check data on the server and wait for the status Assessment received successfully to appear.
A new client card with the assessment will appear in the catalog on the left if it was not there before.
If such a client has already been created, then a new assessment will appear under his card with the inscription “New” on the icon.
You can also go to the loaded assessment by clicking on the underlined and bold text.
After adding recommendations to the assessment, the specialist can send it back to the client.
To do this, he needs to go to the Telemetry tab.
Fill in the fields:
- My e-mail
- Specialist’s / Client’s e-mail
Check the box next to the assessment that will be sent to the client.
Click on the Send the assessment to the server button. Wait until the end of the dispatch.
To receive the recommendations from the specialist in the VedaPulse Home software, the client needs to go to the Expert consultation tab.
Fill in the fields:
- My e-mail
- Specialist’s e-mail
Click on the button Check data on the server and wait for the status Assessment received successfully to appear.
The assessment will be updated in the client’s card (the inscription “New” will appear on the icon).
You can also go to the loaded assessment by clicking on the underlined and bold text.
Data exchange between two VedaPulse Professional devices
To send an assessment from the VedaPulse Professional software, the first specialist needs to go to the Telemetry tab.
Fill in the fields:
- My e-mail
- Specialist’s / Client’s e-mail
Check the box next to the assessment that will be sent to the second specialist.
Click on the Send the assessment to the server button. Wait until the assessment is sent successfully.
To receive the assessment in the VedaPulse Professional software, the second specialist needs to go to the Telemetry tab.
Fill in the fields:
- My e-mail
- Specialist’s / Client’s e-mail
Click on the button Check data on the server and wait for the status Assessment received successfully to appear.
A new client card with the assessment will appear in the catalog on the left if it was not there before.
If such a client has already been created, then a new assessment will appear under his card with the inscription “New” on the icon.
You can also go to the loaded assessment by clicking on the underlined and bold text.
If the form contains valid email, the recipient (a specialist or a client) would receive instant email notifications on each new assessment or reply received within the Telemetry module. Also, at launching the program, the user would get notifications on the number of new assessments received from the clients/colleagues through the Telemetry module during being offline.
Demo
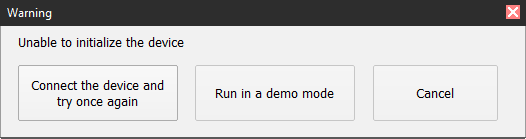
While selecting Assessment/New assessment/Start in Demo mode, you will be able to see the ECG registration window, on which the program will simulate ECG signal. This record will not be saved upon completion. Its purpose is to show users the process of signal registration.
If you run the program using your USB security key, but do not connect the device to the PC, you will see a warning label, which will offer you to run the program in Demo mode.
Settings
To edit settings of VedaPulse program, click the Settings button in the program menu (gear icon). The Settings window contains four tabs:
- Language - change the language of the program interface. It is possible to select up to 14 languages (each language is purchased separately).
- Regional settings. There is a choice of height measurement units — centimeters or feet and inches, and weights — kilograms or pounds.
- Module settings. In this tab, you can choose which names to display in Herbal Encyclopedia lists (botanical or Latin) and in Aroma Encyclopedia lists (common names or botanical names).
- Interface.
- In this tab you can choose modules which you want to paste in autogenerating report.
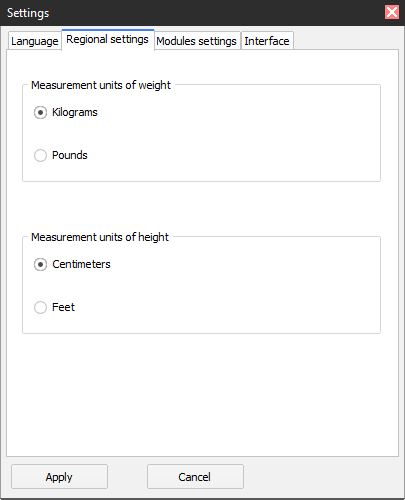
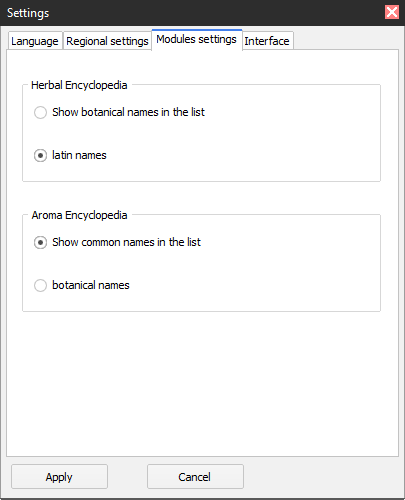
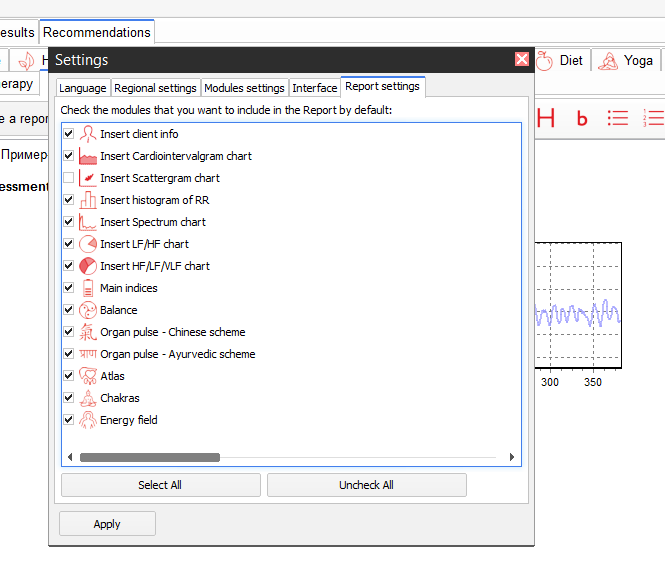
Software update
To update the software, it is not necessary to manually download the installation file and uninstall the previous version. The program will perform all these actions automatically.
If a new version of VedaPulse Professional is available, you will see a message in the top right corner asking you to download the update. The update will be downloaded automatically without blocking the program.
When the download is complete, a yellow New (new version) icon will appear in the menu at the top left of the screen.
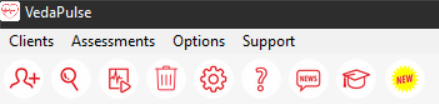
To install a new version of the software, click this icon. The program will close and the Software Installation Wizard will start. Please note that the update will be installed in the same folder where the previous version was installed, without any additional questions and without deleting any data from the catalogue.
You can also install a new version when you close the program. To do this, select 'Update and Close' or 'Update and Restart' from the pop-up window.
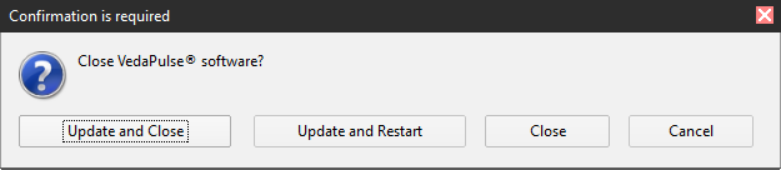
Technical support
E-mail: support@vedapulse.com
Tel.: +7 (913) 452-09-03
Working time: Monday–Friday 5:00-14:00 (MSK).